
FIGURE
Fig. 5
- ID
- ZDB-FIG-180703-26
- Publication
- Lupperger et al., 2017 - Image analysis of neural stem cell division patterns in the zebrafish brain
- Other Figures
- All Figure Page
- Back to All Figure Page
Fig. 5
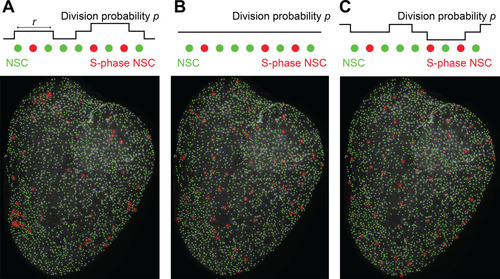
Simulated attractive spatial influence (A), no spatial influence (B), and repulsive spatial influence (C) of S‐phase NSCs result in visually distinct patterns. |
Expression Data
Expression Detail
Antibody Labeling
Phenotype Data
Phenotype Detail
Acknowledgments
This image is the copyrighted work of the attributed author or publisher, and
ZFIN has permission only to display this image to its users.
Additional permissions should be obtained from the applicable author or publisher of the image.
Full text @ Cytometry A