
Image
|
Figure Caption
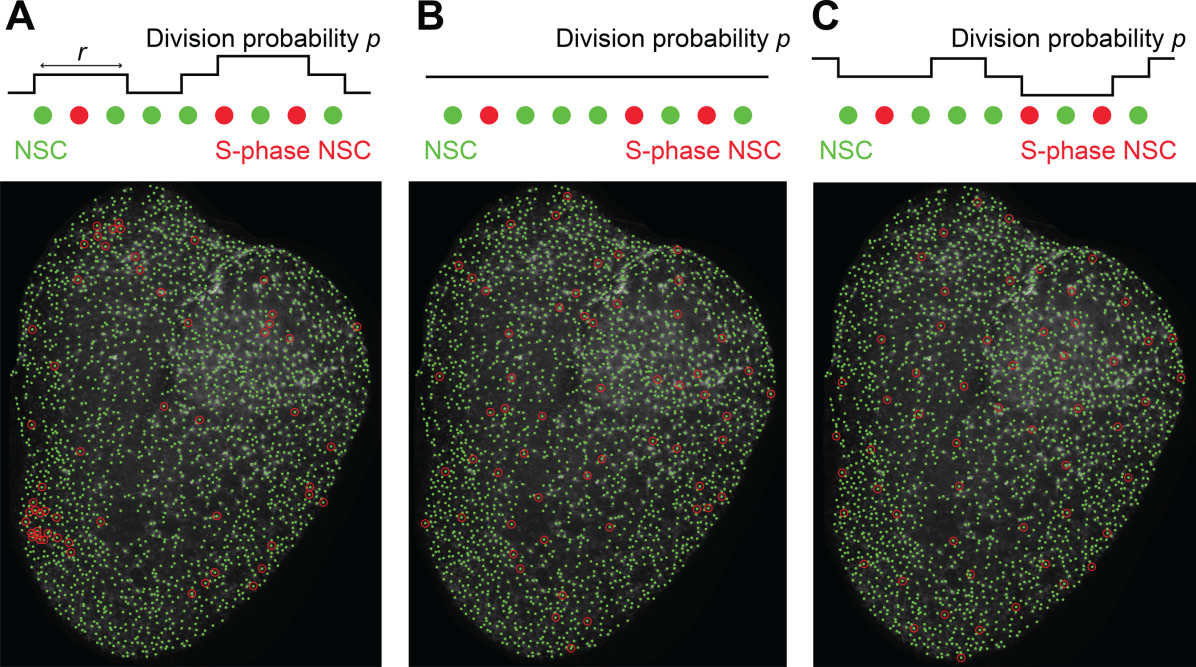
Fig. 5
Simulated attractive spatial influence (A), no spatial influence (B), and repulsive spatial influence (C) of S‐phase NSCs result in visually distinct patterns.
Acknowledgments
This image is the copyrighted work of the attributed author or publisher, and
ZFIN has permission only to display this image to its users.
Additional permissions should be obtained from the applicable author or publisher of the image.
Full text @ Cytometry A