
FIGURE
Fig. 7
- ID
- ZDB-FIG-180703-27
- Publication
- Lupperger et al., 2017 - Image analysis of neural stem cell division patterns in the zebrafish brain
- Other Figures
- All Figure Page
- Back to All Figure Page
Fig. 7
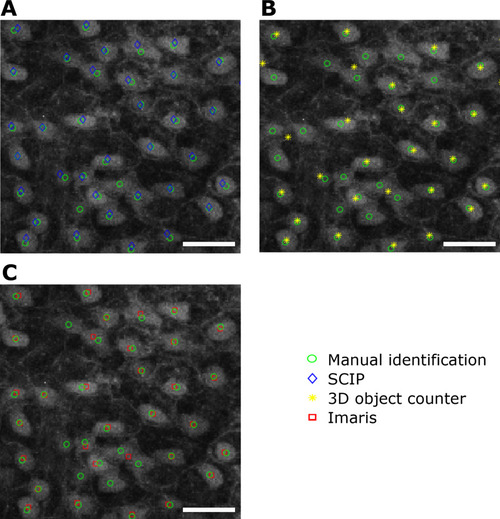
Evaluation of SCIP. We use manually (by P.C.) identified NSCs in different image regions on the 2D maximum intensity projection as ground truth (green circles). We evaluate SCIP (A), the 3D object counter plugin in ImageJ (B), and Imaris (C) by comparison of the identified cells to the manually detected ones. Scale bar: 30 µm. |
Expression Data
Expression Detail
Antibody Labeling
Phenotype Data
Phenotype Detail
Acknowledgments
This image is the copyrighted work of the attributed author or publisher, and
ZFIN has permission only to display this image to its users.
Additional permissions should be obtained from the applicable author or publisher of the image.
Full text @ Cytometry A