
Fig. S6
- ID
- ZDB-FIG-180608-102
- Publication
- van Boxtel et al., 2017 - Long-Range Signaling Activation and Local Inhibition Separate the Mesoderm and Endoderm Lineages
- Other Figures
- All Figure Page
- Back to All Figure Page
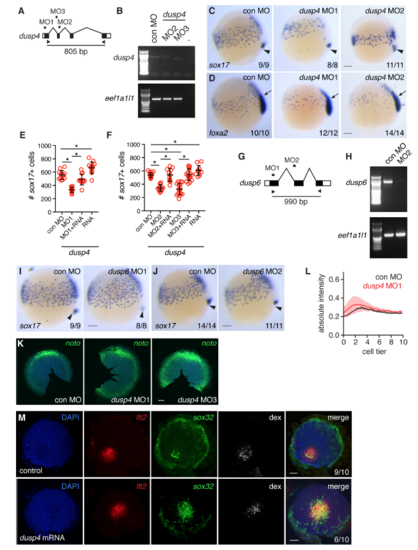
dusp4, but not dusp6 loss-of-function, reduces endoderm specification (A) Schematic representation of knockdown strategy for dusp4 using three non-overlapping MOs (MO1–3). (B) For MO2 and MO3, RT-PCR was performed using the indicated oligonucleotides shown in (A) to generate an 805 bp band. The housekeeping gene eef1a1l1 was used as a control. Note that both splice blocking MOs result in loss of the 805 bp band. (C) WISH for sox17 on 75% epiboly embryos after injection with MO1 and MO2. Arrowhead, dorsal forerunner cells. (D) As in (C) for foxa2. Note reduction of both foxa2 and sox17 with dusp4 knockdown, reflecting reduction of the entire endodermal cell population (see also Figure S1B,C). Arrow, foxa2 expression in the axial mesoderm. (E) Quantification of endodermal cell numbers at 75% epiboly in embryos injected with control MO (con MO), dusp4 MO1 ± 400 pg dusp4 mRNA containing 5 silent mutations in the MO1 binding site, or with the mutated dusp4 mRNA alone. (Means ± SD, * Mann-Whitney U test, p < 0.05) The MO1 phenotype is partially rescued with the mRNA. (F) Quantification of endodermal cell numbers at 75% epiboly in embryos injected with control MO (con MO), dusp4 MO2 or MO3 ± 400 pg dusp4 mRNA, or with the dusp4 mRNA alone. (Means ± SD, * Mann-Whitney U test, p < 0.05) The morphant phenotype is partially rescued with the mRNA. (G) Schematic representation of knockdown strategy for dusp6 using two non-overlapping MOs (MO1 and MO2). (H) RT-PCR for dusp6 after knock down with MO2. (I) WISH for sox17 with dusp6 MO1 at 75% epiboly. (J) As in (I) but using dusp6 MO2. Neither of the dusp6 MOs showed any effect on endodermal cell numbers. In (I) and (J), arrowhead marks dorsal forerunner cells. (K) Flat-mounted 50% epiboly embryos stained for noto after knockdown of dusp4. (L) Quantification of noto profile after injection with dusp4 MO1 compared to control MO. For each condition, n=3, means are shown by the lines and the shading indicates the SD. (M) Flat-mounted germ ring stage embryos containing a Nodal clone that were either control injected or injected with dusp4 mRNA and stained for sox32 and lft2. These are the same embryos as shown in Figure 6F, but here individual channels are shown. All scale bars are 100 μm. |
Reprinted from Developmental Cell, 44(2), van Boxtel, A.L., Economou, A.D., Heliot, C., Hill, C.S., Long-Range Signaling Activation and Local Inhibition Separate the Mesoderm and Endoderm Lineages, 179-191.e5, Copyright (2017) with permission from Elsevier. Full text @ Dev. Cell