
Fig. 1
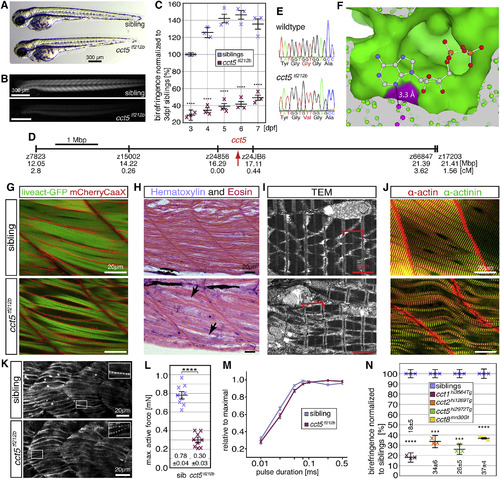
A Missense Mutation in cct5 Causes Muscle Impairment within cct5tf212b (A) At 3 dpf, cct5tf212b mutants appear similar to their siblings under bright-field conditions (n = 6 per genotype). (B) Representative images of 3-dpf-old cct5tf212b mutants under polarized light show a reduction in birefringence (quantified in C). (C) Quantification of birefringence followed by normalization to 3-dpf-old siblings revealed a highly significant reduction in cct5tf212b homozygotes through 7 dpf. Data are mean ± SEM; ∗∗∗∗p < 0.0001 homozygotes versus siblings of the same stage by one-way ANOVA with Tukey’s post hoc test; n = 3. (D) SSLP-based mapping linked the phenotype-causing mutation to cct5 on chromosome 24. SSLP positions are shown in centimorgans and million base pairs according to the zebrafish genome assembly. Scale bar, 1 Mbp. (E) Sequencing identified a missense mutation in exon 9 of cct5 (G422V). (F) G422 (pink) forms part of the ATP-binding pocket (surface representation, green) of human CCT5. The glycine carbon is only 3.3 Å away from the adenosine nitrogen (stick representation, blue). (G) Labeling of the sarcolemma with mCherryCaaX and the myofibril with Lifeact-GFP confirmed a reduced amount of myofibrils within cct5tf212b homozygotes (n = 4 per genotype). (H) H&E-stained sagittal sections of 6-dpf-old larvae confirmed the reduced amount of myofibrils in cct5tf212b; arrows mark enlarged regions of the sarcoplasm (n = 8 per genotype). (I) Representative transmission electron micrographs depicting organized sarcomeres, marked by brackets, in 3-dpf siblings and cct5tf212b mutants (n = 3 per genotype). (J) Immunohistochemistry with antibodies against actin (red) and α-Actinin (green) enabled quantification of the sarcomere width that was not altered in cct5tf212b (n = 3 per genotype). (K) At the 18-somite stage, regularly spaced actinin-positive Z-bodies indicate the presence of pre-myofibrils in siblings and cct5tf212b homozygotes (n = 4 per genotype). (L) Maximal force generation of cct5tf212b were significantly impaired compared with siblings. Data are mean ± SEM; ∗∗∗∗p < 0.0001 by Student’s t test; n = 9. (M) Pulse duration and active force relationships are similar in both groups, suggesting unchanged motor neuron excitation. Data are mean ± SEM; n = 10. (N) The insertion mutants cct1hi3564Tg, cct2hi1269Tg, cct5hi2972Tg, and cct8mn30Gt all feature a highly significant reduction in birefringence. Data are mean ± SEM; ∗∗∗p < 0.001 and ∗∗∗∗p < 0.0001 by Student’s t test; n = 3. See also Figures S1–S5. |
| Genes: | |
|---|---|
| Antibody: | |
| Fish: | |
| Anatomical Terms: | |
| Stage Range: | 14-19 somites to Protruding-mouth |