
Fig. 1
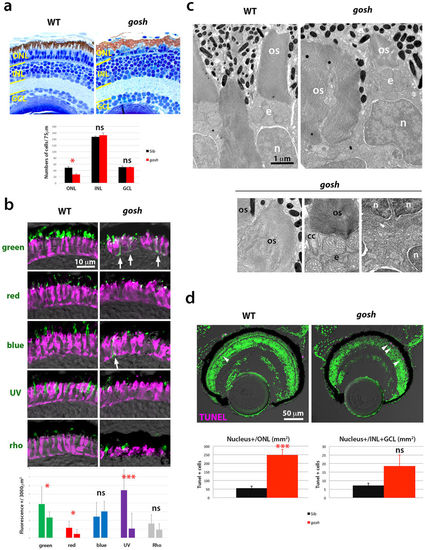
Photoreceptor phenotypes of the gosh mutant at 7 dpf. (a) (Upper) Sections of 7 dpf wild-type and gosh mutant retinas. In the gosh mutant, the ONL is thinner with abnormally shaped OS. However, INL and GCL appear to be normal. (Lower) Histogram of cell number of the ONL, INL, and GCL at 7 dpf in wild type (black) and gosh mutant (red). Numbers of nuclei within 75 μm length for each layer were counted (n = 3). Only ONL cells are significantly reduced in the gosh mutant (p = 0.026, students’ t-test). (b) (Upper) Labeling of wild-type and gosh mutant retinas with antibodies against green, red, blue, UV opsins, and rhodopsin (green), and zpr1 antibody (magenta). In the gosh mutant, the opsin-localized OS area is small, and opsins are often mislocalized to plasma membranes of cell bodies or synaptic areas (arrows). In contrast, rhodopsin localization to the OS seems to be normal. (Lower) Histogram of visual pigment-positive area at 7 dpf in wild type (left bars) and gosh mutant (right bars). The percentage of visual pigment-positive areas relative to a 3000 μm2 area containing the ONL was measured (n = 3 for each). Green, red, and UV opsin-positive areas were reduced in the gosh mutant, while there was no difference in blue and rhodopsin-expressing areas between gosh mutants and wild types. (c) EM images of wild-type and gosh mutant photoreceptors. The OS is composed of multiple, stacked photoreceptive membrane discs. Beneath the OS, mitochondria accumulate to form the ellipsoid (e). Although global shapes of the OS and nucleus (n) are deformed in gosh mutants, their fine structures, including the connecting cilium (cc), seem to be normal. Synaptic structures in the OPL appear to be less developed in the gosh mutant. (d) TUNEL of wild-type and gosh mutant retinas at 7 dpf (magenta). Apoptotic cells are indicated by arrowheads. Histogram of apoptotic cell number in the ONL (left) and the INL+GCL (right). In the gosh mutant, apoptotic cell number is markedly increased in the ONL. OS, outer segment; INL, inner nuclear layer; GCL, ganglion cell layer; n, nucleus; cc, connecting cilium; e, ellipsoid. (ns, p>0.05; *p<0.05; ***p<0.001). |
| Antibodies: | |
|---|---|
| Fish: | |
| Anatomical Term: | |
| Stage: | Days 7-13 |
| Fish: | |
|---|---|
| Observed In: | |
| Stage: | Days 7-13 |