
Fig. 1
- ID
- ZDB-FIG-171229-1
- Publication
- Shainer et al., 2017 - Novel hypophysiotropic AgRP2 neurons and pineal cells revealed by BAC transgenesis in zebrafish
- Other Figures
- All Figure Page
- Back to All Figure Page
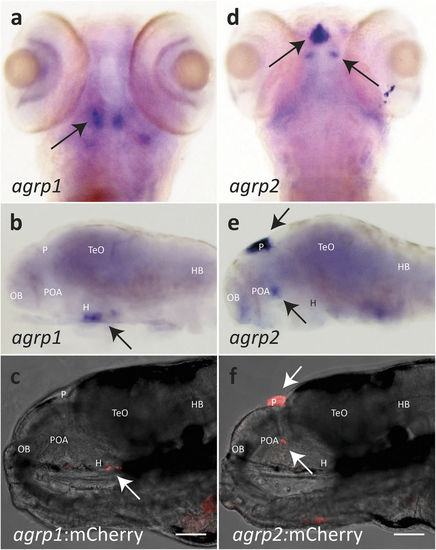
AgRP1 and AgRP2 BAC transgenic lines reflect endogenous agrp1 and agrp2 expression patterns. Endogenous mRNA expression of agrp1 and agrp2 was compared to the transgene expression in agrp1:mCherry and agrp2:mCherry larvae, respectively, at 6 dpf. (a,b) ISH analysis for agrp1 mRNA expression in a wild-type larva at 6 dpf. (a) Ventral and (b) lateral views of larvae brains. agrp1 mRNA expression is localized to the ventral periventricular hypothalamus. (c) Lateral view of a 6-dpf agrp1:mCherry transgenic larva. Specific mCherry signal is observed in the ventral periventricular hypothalamus (arrow), which replicates the expression pattern of agrp1 mRNA. (d,e) ISH analysis of agrp2 mRNA expression in a 6-dpf wild-type larva. (d) Dorsal and (e) lateral views of larvae brains. Strong expression of agrp2 mRNA is observed in the pineal gland (top arrow); weaker bilateral agrp2 mRNA expression is observed in the preoptic area (bottom arrow). (f) Lateral view of the brain of a 6-dpf agrp2:mCherry transgenic larva. The expression pattern of mCherry replicates both pineal (top arrow) and preoptic (bottom arrow) agrp2 mRNA expression. (a,d) Anterior to top; (b,c,e,f) anterior to left. H, hypothalamus; HB, hindbrain; OB, olfactory bulb; P, pineal gland; POA, preoptic area; TeO, optic tectum. Scale bar, 100 μm. |
| Genes: | |
|---|---|
| Fish: | |
| Anatomical Terms: | |
| Stage: | Day 6 |