
|
Fig. 1
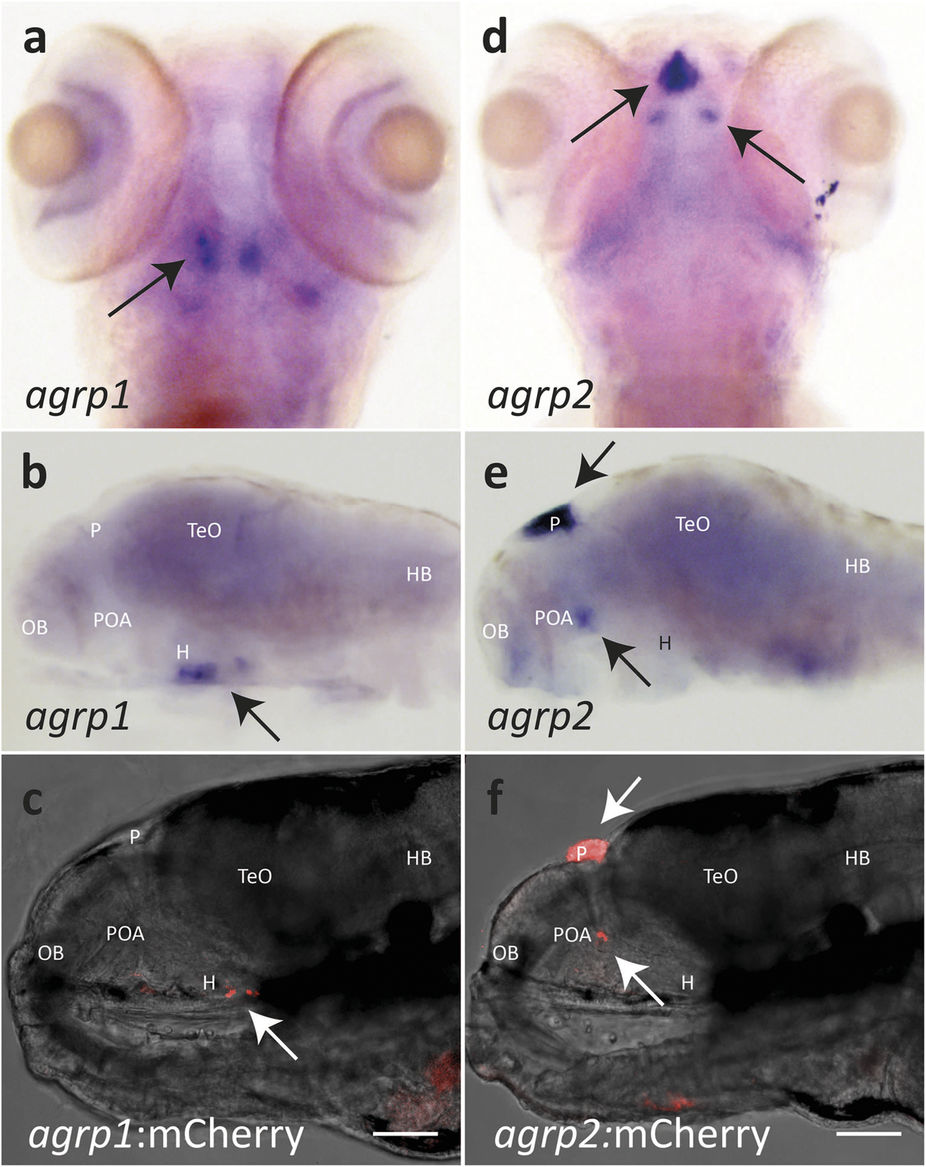
AgRP1 and AgRP2 BAC transgenic lines reflect endogenous agrp1 and agrp2 expression patterns.
Endogenous mRNA expression of agrp1 and agrp2 was compared to the transgene expression in agrp1:mCherry and agrp2:mCherry larvae, respectively, at 6 dpf. (a,b) ISH analysis for agrp1 mRNA expression in a wild-type larva at 6 dpf. (a) Ventral and (b) lateral views of larvae brains. agrp1 mRNA expression is localized to the ventral periventricular hypothalamus. (c) Lateral view of a 6-dpf agrp1:mCherry transgenic larva. Specific mCherry signal is observed in the ventral periventricular hypothalamus (arrow), which replicates the expression pattern of agrp1 mRNA. (d,e) ISH analysis of agrp2 mRNA expression in a 6-dpf wild-type larva. (d) Dorsal and (e) lateral views of larvae brains. Strong expression of agrp2 mRNA is observed in the pineal gland (top arrow); weaker bilateral agrp2 mRNA expression is observed in the preoptic area (bottom arrow). (f) Lateral view of the brain of a 6-dpf agrp2:mCherry transgenic larva. The expression pattern of mCherry replicates both pineal (top arrow) and preoptic (bottom arrow) agrp2 mRNA expression. (a,d) Anterior to top; (b,c,e,f) anterior to left. H, hypothalamus; HB, hindbrain; OB, olfactory bulb; P, pineal gland; POA, preoptic area; TeO, optic tectum. Scale bar, 100 μm.