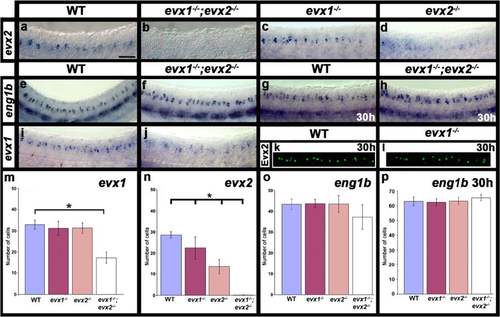
Expression of evx and eng1b genes in evx1;evx2 double mutant embryos. Lateral views of zebrafish spinal cord at 24 h (a-f, i & j) or 30 h (g, h, k & l ). Anterior left, dorsal up. a-j in situ hybridization for each gene indicated. e-h strong ventral expression is in muscle pioneer cells, expression in more individual dorsal cells corresponds to spinal cord V1 cells. k & l immunohistochemistry for Evx2. m-p Average number of cells (y-axis) expressing indicated marker in spinal cord region adjacent to somites 6-10 in WT embryos and evx1 and evx2 single and double mutants (x-axis) at 24 h (m-o) or 30 h (p). Values are shown as mean +/- standard deviation (values are provided in Table 1). There are no evx2-positive cells in the double mutants (n). In each case at least 5 embryos were counted, except for eng1b where 4 embryos were counted. Statistically significant differences (P < 0.05) from WT values are indicated with brackets and stars. P values for these and other comparisons (e.g differences between single and double mutants) are provided in Table 1. Scale bar: 50 μm (a-l)
|
