
Fig. 6
- ID
- ZDB-FIG-171108-6
- Publication
- Juárez-Morales et al., 2016 - Evx1 and Evx2 specify excitatory neurotransmitter fates and suppress inhibitory fates through a Pax2-independent mechanism
- Other Figures
- All Figure Page
- Back to All Figure Page
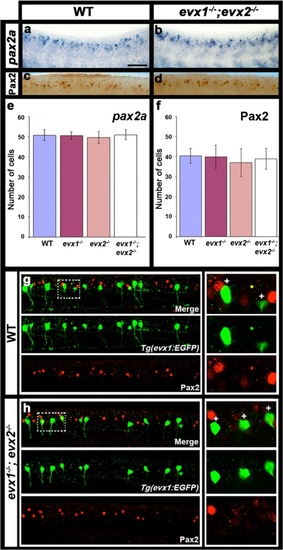
V0v cells do not express Pax2 in WT or evx1;evx2 double mutant embryos. Lateral views of zebrafish spinal cord at 24 h (a-d) or 30 h (g & h). Anterior left, dorsal up. a & b in situ hybridization for pax2a. c & d immunohistochemistry for Pax2. The Pax2 antibody recognizes both Pax2a and Pax2b. e & f Average number of cells (y-axis) expressing these markers (indicated in each case) in spinal cord region adjacent to somites 6-10 in WT embryos and evx1 and evx2 single and double mutants (x-axis). Values are shown as mean +/- standard deviation (values are provided in Table 1). In each case at least 5 embryos were counted, except for pax2a where 4 embryos were counted. P values for all comparisons are provided in Table 1. g & h EGFP (green) and Pax2 (red) expression in Tg(evx1:EGFP) SU2 WT (g) and evx1;evx2 double mutant (h) embryos. No V0v cells express Pax2 in either case. Panels on RHS are magnified single-confocal-plane views of white dotted rectangle regions in panels G and H respectively. White crosses indicate single-positive GFP cells. Scale bar: 50 μm (a-d) & 40 μm (g-h) |
| Genes: | |
|---|---|
| Antibody: | |
| Fish: | |
| Anatomical Terms: | |
| Stage Range: | Prim-5 to Prim-15 |