
Fig. S5
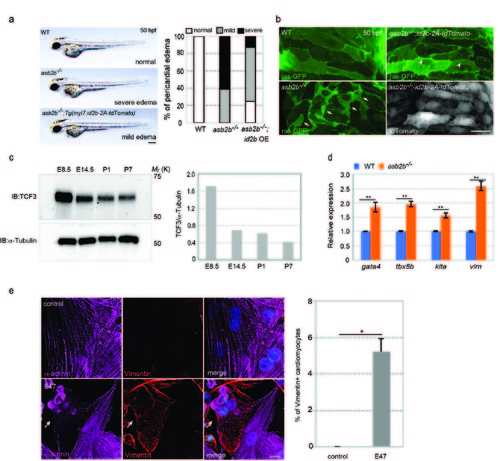
asb2b mutant and TCF3 overexpressing cardiomyocytes exhibit a number of phenotypes associated with cardiomyocyte dedifferentiation. (a) Brightfield micrographs of 50 hpf WT, asb2b mutant or Tg(myl7:id2b-p2a-tdTomato) asb2b mutant embryos in lateral views. Anterior to the left. Scale bar, 200 μm. Number of fish exhibiting pericardial edema (n=20 fish). (b) 3D images of 50 hpf Tg(myl7:ras- GFP) WT and asb2b mutant atria as well as Tg(myl7:ras-GFP);Tg(myl7:id2b-2AtdTomato) asb2b mutant atria. asb2b mutant cardiomyocytes exhibit irregular cell-cell borders and membrane protrusions (arrows), whereas id2b-overexpressing asb2b mutant cardiomyocytes exhibit less severe morphological phenotypes (arrowheads). (c) E8.5, E14.5, P1 and P7 mouse hearts were isolated and TCF3 protein levels were analyzed; relative expression levels shown on the right. (d) Relative mRNA expression (qPCR) of gata4, tbx5b, kita and vim in isolated 50 hpf WT (blue bar) and asb2b mutant (orange bar) hearts (n=2 technical replicates, RNA samples were obtained from 500 isolated hearts). (e) Rat NCMs transfected with control or E47 adenovirus vectors, co-stained for α-actinin (magenta), Vimentin (red) and DAPI (blue). Arrow points to a Vimentin-positive cardiomyocyte. Number of Vimentin-positive Rat NCMs (n=2, with averages taken from 50 cardiomyocytes). *P<0.05, **P<0.01 by one-way analysis of variance (ANOVA) followed by Tukey’s HSD test. Error bars, SEM. Scale bars, 20 μm. |