
Fig. 2
- ID
- ZDB-FIG-170830-19
- Publication
- Xia et al., 2017 - Zebrafish slc30a10 deficiency revealed a novel compensatory mechanism of Atp2c1 in maintaining manganese homeostasis
- Other Figures
- All Figure Page
- Back to All Figure Page
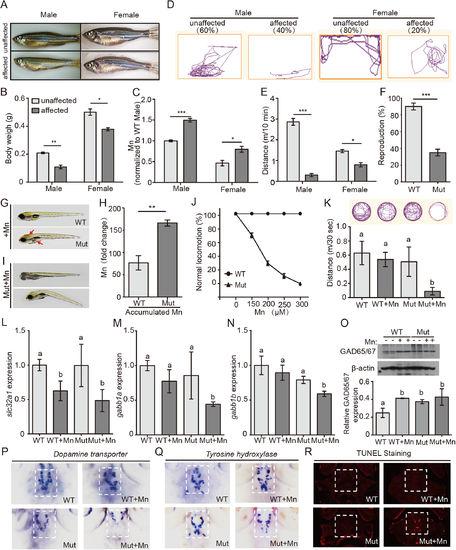
Slc30a10 mutants develop impaired neurological function. (A) Example images of affected mutant adults and their unaffected siblings; note the thinner body shape of the affected siblings. (B) Summary of body weight of affected adults and unaffected siblings (n = 4 adults/group). (C) Affected mutants have higher Mn levels compared to their unaffected siblings (n = 4 adults/group). (D) Example movement traces of affected adults and their unaffected siblings. (E) Affected adults swim shorter distances than their unaffected siblings (n = 6 adults/group). (F) Summary of the reproductive capacity of WT and mutant adults (n = 20 adults/group). (G) Example images of a wild-type and mutant embryo, showing a darker color in the brain and liver (red arrows) in the mutant. (H) Mn exposure causes a larger increase in Mn accumulation in mutant animals compared to wild-type animals (n = 3 sets of 200 embryos/group). (I) Example images of two mutant embryos after Mn exposure. Note the distorted body shape of the Mn-treated mutant. (J) Locomotion (measured as swimming and a normal escape response) is reduced in mutant embryos following Mn treatment, whereas wild-type animals are not affected (n = 3 sets of 20 embryos/group). (K) Mutant embryos exposed to Mn swim a shorter distance than untreated mutants and wild-type embryos (n = 6 embryos/group). (L) Slc32a1 expression is reduced in both wild-type and slc30a10 embryos following Mn exposure (n = 3 sets of 20 embryos/group). (M-N) Gabb1a (M) and gabb1b (N) expression is reduced in Mn-exposed slc30a10 mutants (n = 3 sets of 20 embryos/group). (O) Western blot analysis of Gad65/67 in wild-type and mutant embryos treated with or without Mn. (P-Q) In situ hybridization of dat and th in mutant embryos following Mn exposure, showing reduced expression of both genes compared to untreated mutants and WT embryos. (R) TUNEL staining in the brain of mutant embryos following Mn exposure, showing increased apoptosis compared to untreated mutants and WT embryos. *p<0.05, **p<0.01, and ***p<0.001; in K‒O, groups with different letters differed significantly (p<0.05). |
| Genes: | |
|---|---|
| Antibody: | |
| Fish: | |
| Condition: | |
| Anatomical Terms: | |
| Stage: | Day 6 |
| Fish: | |
|---|---|
| Condition: | |
| Observed In: | |
| Stage Range: | Day 6 to Adult |