
Fig. 1
- ID
- ZDB-FIG-170612-2
- Publication
- Mott et al., 2017 - Expressing acetylcholine receptors after innervation suppresses spontaneous vesicle release and causes muscle fatigue
- Other Figures
- All Figure Page
- Back to All Figure Page
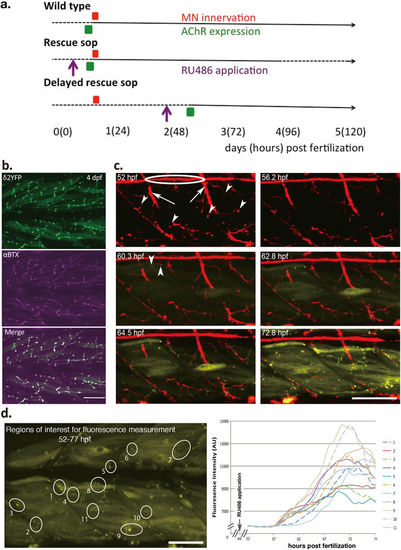
Synapse formation in delayed rescue sop. (a) A summary of the experimental paradigm, showing events related to the synapse development and manipulations along the developmental time course. Numbers indicate days post fertilization (hours post fertilization in parentheses). Dashed lines indicate periods when zebrafish embryos are immotile, and solid lines indicate stages when embryos exhibit mobility. Timing of motor neuron axon innervation (red), AChR expression (green) and RU486 application (purple) are indicated by boxes and arrows. (b) δ2YFP (top), αBTX (middle) and merged (bottom) in the trunk region of a 4 dpf delayed rescue sop are shown. (c) Time-lapse images of axons (red) and AChRs (yellow) in vivo from delayed rescue sop embryos. In the 52 hpf panel, lateral line axons (circled) and motor neuron trunks (arrows) are visualized. Motor neuron terminals are indicated by arrowheads. In the 60.3 hpf panel, the first expressed AChR clusters are detected, indicated by arrowheads. (d) Analysis of fluorescence intensity of identified regions with AChR clusters in delayed rescue sop. Fluorescence from the marked regions of interest (labeled 1–10) was measured and plotted against hours post fertilization. RU486 was applied at 48 hpf, before the measurement of fluorescence started. Scale bars: 50 µm. |