
Fig. 7
- ID
- ZDB-FIG-161221-28
- Publication
- Mahalwar et al., 2016 - Heterotypic interactions regulate cell shape and density during color pattern formation in zebrafish
- Other Figures
- All Figure Page
- Back to All Figure Page
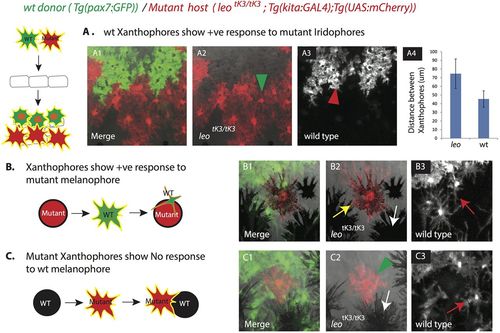
Transplantation of wild-type xanthophores labeled with Tg(pax7:GFP) into leotK3/tK3 mutants carrying Tg(kita:GAL4);Tg(UAS:mCherry). (A1) Different density of wild-type (green cells, red arrow head in A3) and mutant xanthophores (red cells, green arrow head in A2) in an adult chimeric animal. (A4) Graph showing the distances (in µm) between the centers of neighboring wild-type and mutant xanthophore pairs in the chimera, error bars indicate standard deviation (n=15 pairs). (B) A wild-type xanthophore (labeled with GFP) becomes stellate (red arrow in B3) in response to a mutant melanophore (labeled with mCherry, yellow arrow in B2). White arrow in B2 points to wild-type melanophores. (C) No response and change in shape of mutant xanthophores (labeled with mCherry, green arrowhead in C2) in response to wild-type melanophores (no fluorescent label, white arrow in C2). Red arrow in C3 points to wild-type xanthophores (labeled with GFP) showing wild-type morphology in response to wild-type melanophores. |