
Fig. 2
- ID
- ZDB-FIG-161221-23
- Publication
- Mahalwar et al., 2016 - Heterotypic interactions regulate cell shape and density during color pattern formation in zebrafish
- Other Figures
- All Figure Page
- Back to All Figure Page
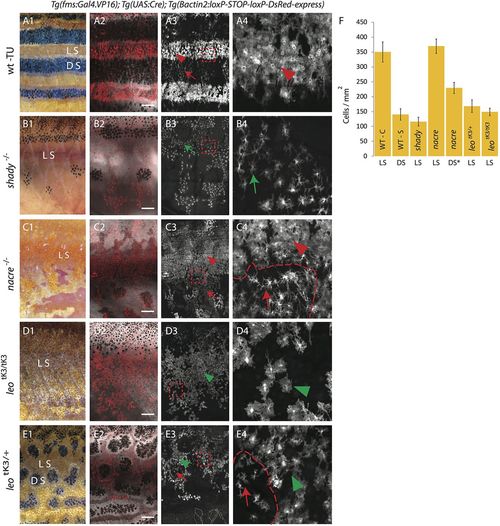
Density and organization of xanthophores in various pigment cell mutants. DsRed-positive xanthophores labeled with Tg(fms:Gal4.VP16); Tg(UAS:Cre); Tg(βactin2:loxP-STOP-loxP-DsRed-express) in wild type and mutants. Due to variegated expression of the transgenes not all xanthophores are labelled. (A1-4) Wild type. (A1) Pigmentation pattern in adult wild-type fish (TU), LS, light stripe; DS, dark stripe. (A2) compact xanthophores (arrowhead) in the light stripe and loose xanthophores (arrow) the in dark stripe areas. (A3) A magnified image of the light stripe region in wild-type fish (red dotted box in A3) shows the high density of compact xanthophores (red arrowhead). (B1-4) Homozygous shady mutants lacking iridophores. (B1,B2) Overview showing the residual melanophore pattern in the mutant. In (B2,B3) the uniform organization of xanthophores (green arrow) is visible. (B4) Magnified image (red dotted box in B3) shows lower density and different morphology of xanthophores (green arrow). (C1-4) Homozygous nacre mutants lacking melanophores. (C1,C2) Overview showing irregular areas of epithelial-like dense iridophores; LS, light stripe. In (C3) the compact (arrowhead) and loose (arrow) shape of xanthophores is visible. (C4) Magnified image (red dotted box in C3) shows high (arrowhead) and low (arrow) density of xanthophores at a light stripe border area (dotted red line). (D1-4) Homozygous leotK3tK3 mutant. (D1,D2) Overview showing that all three pigment cell types are present. In (D3,D4) the low density and uniform distribution of xanthophores (green arrowhead) is visible; (D4) magnified image (red dotted box in D3) shows uniform cell shape and distribution of xanthophores (green arrowhead). (E1-4) Heterozygous leotK3 mutants. (E1,E2) Overview indicating the light stripe (LS) and dark stripe (DS) areas. In (E3) the low density but non-uniform distribution of xanthophores in light (green arrow head) and dark (red arrow) stripe regions is visible. (E4) Magnified image (red dotted box in E3) showing stellate (arrow) and compact (green arrowhead) xanthophores with lower density at a melanophore spot boundary (dotted red line). Scale bars: 500 µm. (F) Graph showing the density (number of xanthophores per mm2) in light or dark stripe regions of wild type and mutants. Values are presented as mean± standard deviation. Asterisk indicate the statistical significance compared to the cell density in wild-type light stripe using Student's t-test. Wild-type compact (WT-C) in light stripe (LS): 349.72 cells/mm2 ±33.67, Wild-type stellate (WT-S) in dark stripe (DS): 139.82 cells/mm2±19.16 (P<0.0001); homozygous shady light stripe (shady -LS): 116.26 cells/mm2±14.55 (P<0.0001), homozygous nacre light stripe (nacre -LS): 369.54 cells/mm2±24.30, homozygous nacre dark stripe (nacre -DS): 229 cells/mm2 ±18, heterozygous, leotK3 light stripe (leotK3/+ - LS): 168.03 cells/mm2±21.06 (P<0.0001), homozygous leotK3 light stripe (leotK3/tK3 - LS): 148.71 cells/mm2±12.28 (P<0.0001). n=10 adult (90 dpf) fish per genotype, except for nacre dark stripe, n=8. |