
Fig. 4
- ID
- ZDB-FIG-161221-25
- Publication
- Mahalwar et al., 2016 - Heterotypic interactions regulate cell shape and density during color pattern formation in zebrafish
- Other Figures
- All Figure Page
- Back to All Figure Page
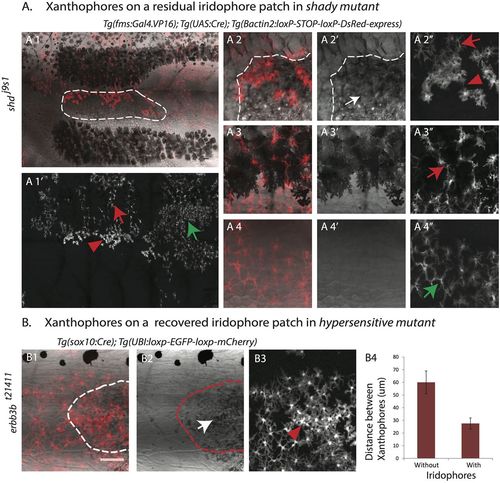
Iridophores lead to a higher density and change in the organization of xanthophores. (A) Adult shady mutant with DsRed-positive xanthophore patches labeled with Tg(fms:Gal4.VP16); Tg(UAS:Cre); Tg(βactin2:loxP-STOP-loxP-DsRed-express). Xanthophores show a compact organization and higher density (red arrowhead in A1′ and A2″) on top of escaper iridophores (outlined in A1 and white arrow in A2′). They are stellate and loosely packed on top of the dark stripe melanophores (red arrow in A1′ and A3″). (A4-4″) Magnified image of the first light-stripe region shows the stellate shape of xanthophores in the absence of the other two pigment cell types (green arrow in A1′ and A4″). (B) erbb3bt21411 metamorphic fish showing a patch of missing iridophores and patchy clones of mCherry-positive xanthophores labeled with Tg(sox10:Cre); Tg(UBI:loxp-EGFP-loxp-mCherry). The recovery of iridophores (outlined in B1 and B2, white arrow in B2) leads to denser and more compact xanthophores (red arrowhead in B3); in the absence of iridophores xanthophores remain at lower density. Scale bar: 100 µm. (B4) Graph showing the distances (in µm) between the centers of neighboring xanthophores in the absence or presence of iridophores (n=15 pairs). |