
Fig. 3
- ID
- ZDB-FIG-161221-24
- Publication
- Mahalwar et al., 2016 - Heterotypic interactions regulate cell shape and density during color pattern formation in zebrafish
- Other Figures
- All Figure Page
- Back to All Figure Page
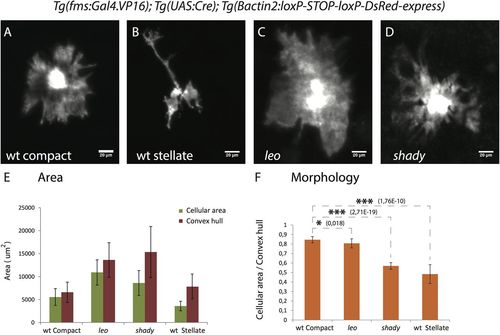
Xanthophore cell morphologies. (A-D) High resolution images of xanthophores in wild type and mutants showing the different morphologies. (A) Wild-type compact xanthophore, (B) wild-type stellate xanthophore, (C) leotK3/tK3 xanthophore and (D) shady xanthophore, scale bar: 20 µm. (E) Graph depicting the cell areas (green bars) and the areas of a simple polygon covering the cells (convex hull, red bars) for individual xanthophores in different genotypes (n=15 adult (90 dpf) fish per genotype). (F) Graph showing the ratios of cellular areas to convex hull areas as a measure to quantify the differences in cell morphology between wild type, leotK3/tK3 and shady mutants. The ratio for compact xanthophores in wild type is significantly higher than for wild-type stellate xanthophores (P<0.0001), xanthophores in leotK3/tK3 (P<0.01) and shady (P<0.0001) mutants. Asterisks indicate the statistical significance using Student's t-test and error bars indicate standard deviations. |