
FIGURE
Fig. S4
- ID
- ZDB-FIG-161205-21
- Publication
- Kumar et al., 2016 - Quantitative in vivo optical tomography of cancer progression & vasculature development in adult zebrafish
- Other Figures
- All Figure Page
- Back to All Figure Page
Fig. S4
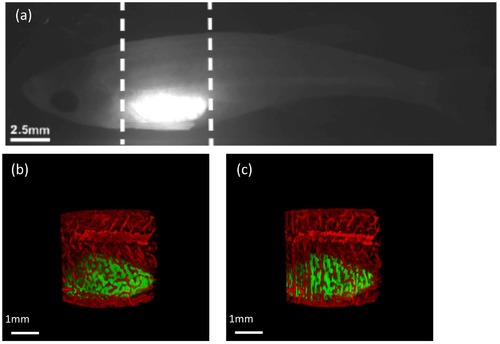
3-dimensional reconstructions of adult TraNac Tg (KDR:mCherry:Fabp10-rtTA:TREeGFPKRASV12) zebrafish after tumour induction using FBP and CS. a. Wide-field fluorescence intensity image (acquired as individual OPT projection) of tumour excited at 488 nm. b, c. Reconstructions of the tumour and vasculature (Hessian-based analysis) in the region indicated by dotted lines using (b) FBP with 512 Projections and (c) CS with 64 projections respectively. |
Expression Data
Expression Detail
Antibody Labeling
Phenotype Data
Phenotype Detail
Acknowledgments
This image is the copyrighted work of the attributed author or publisher, and
ZFIN has permission only to display this image to its users.
Additional permissions should be obtained from the applicable author or publisher of the image.
Full text @ Oncotarget