
FIGURE
Fig. 4
- ID
- ZDB-FIG-161205-17
- Publication
- Kumar et al., 2016 - Quantitative in vivo optical tomography of cancer progression & vasculature development in adult zebrafish
- Other Figures
- All Figure Page
- Back to All Figure Page
Fig. 4
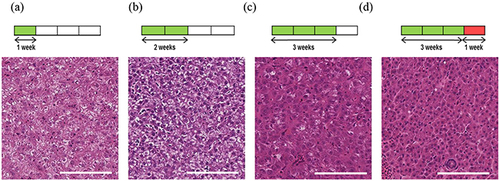
Induction and progression of HCC in adult TraNac Tg (KDR:mCherry:Fabp10-rtTA:TRE-eGFPKRASV12) zebrafish. Images of H&E stained representative tumour sections following tumour induction for a. one week, b. two weeks and c. three weeks with d. imaged after three weeks of induction plus a further week after removal of inducer treatment. Each group (n=6-8) Scale bars 100 μm. |
Expression Data
Expression Detail
Antibody Labeling
Phenotype Data
| Fish: | |
|---|---|
| Condition: | |
| Observed In: | |
| Stage: | Adult |
Phenotype Detail
Acknowledgments
This image is the copyrighted work of the attributed author or publisher, and
ZFIN has permission only to display this image to its users.
Additional permissions should be obtained from the applicable author or publisher of the image.
Full text @ Oncotarget