|
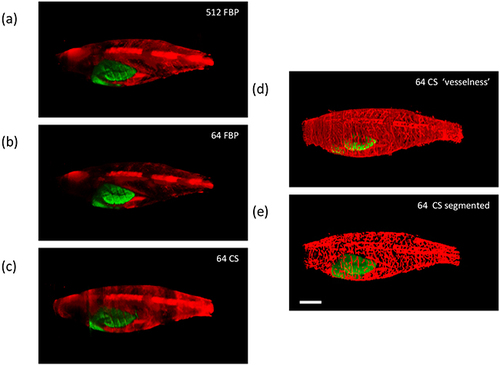
Exemplar reconstructed OPT images of adult [81 days post fertilization (dpf)] TraNac Tg (KDR:m Cherry:Fabp10-rtTA:TRE-eGFPKRASV12) zebrafish expressing liver specific eGFP-labelled tumour and mCherry-labelled vasculature showing maximum intensity projections of eGFP (green) and mCherry (red) fluorescence (scale bar = 2.5 mm). a. and b. show FBP reconstructed images computed with 512 and 64 projections respectively, c. shows the corresponding image reconstructed from 64 projections using the CS-OPT approach, d. shows the “vesselness” of the same reconstruction and e. shows the “final” segmented image of the vasculature. See Supplementary Video S1 for corresponding 3-D animations.
|