
FIGURE
Fig. S3
- ID
- ZDB-FIG-161205-20
- Publication
- Kumar et al., 2016 - Quantitative in vivo optical tomography of cancer progression & vasculature development in adult zebrafish
- Other Figures
- All Figure Page
- Back to All Figure Page
Fig. S3
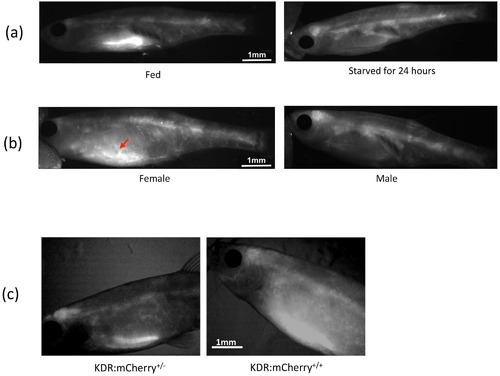
Fluorescent properties of adult TraNac Tg (KDR:mCherry:Fabp10-rtTA:TRE-eGFPKRASV12) zebrafish excited at 561nm. a. Wide-field fluorescence intensity images (acquired as individual OPT projections) of fed and starved zebrafish indicating auto fluorescence in the gut of fed zebrafish. b. Wide-field fluorescence intensity images of starved zebrafish indicating light scattering in abdomen due to eggs in female (arrow indicates scattering by the eggs). c. Wide field fluorescence microscope images of heterozygous (KDR:mCherry(+/-)) and homozygous (KDR:mCherry(+/+)) zebrafish. |
Expression Data
Expression Detail
Antibody Labeling
Phenotype Data
Phenotype Detail
Acknowledgments
This image is the copyrighted work of the attributed author or publisher, and
ZFIN has permission only to display this image to its users.
Additional permissions should be obtained from the applicable author or publisher of the image.
Full text @ Oncotarget