
Fig. 1
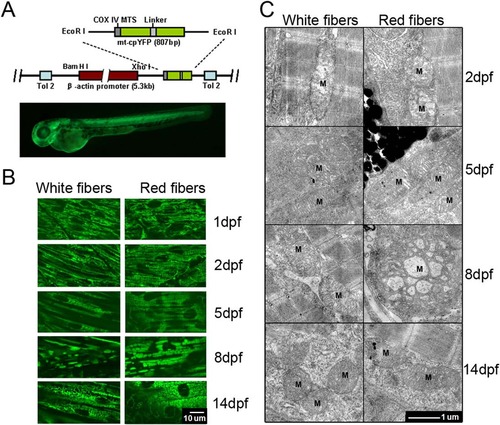
Mitochondrial morphogenesis in developing zebrafish skeletal muscles. (A) Top: A schematic map of Tg(β-actin:mt-cpYFP) reporter construct, in which mt-cpYFP was driven by the chicken β-actin promoter. The N-terminus of cpYFP was tagged with the COX IV mitochondrial localization signal (COX IV MTS). The transgene was flanked with Tol2 elements (Tol2) to facilitate transgenesis in zebrafish. Bottom: ubiquitous expression of mt-cpYFP in a Tg(β-actin:mt-cpYFP) transgenic embryo at 2 dpf. (B) Confocal images of mitochondria in white (left panels) and red (right panels) skeletal muscles of Tg(β-actin:mt-cpYFP) embryos from 1 to 14 dpf. Note the fibrillar mitochondria at 1 and 2 dpf, while the rod-like mitochondria at 5, 8 and 14 dpf in white skeletal muscles, whereas large brick-like at 8 dpf and smaller bead-like mitochondria at 5 and 14 dpf in red skeletal muscles. Scale bar, 10 µm. (C) Transmission electron microscopic images of mitochondria (M) in white (left panels) and red (right panels) skeletal muscle cells of Tg(β-actin:mt-cpYFP) transgenic embryos from 2 to 14 dpf. Red skeletal muscle cells were identified along with melanocytes. Note fewer immature cristae in mitochondria at 2 dpf but well-developed cristae in mitochondria at 5, 8 and 14 dpf in both red and white muscle fibers. Mitochondria were particularly enlarged in red muscle cells at 8 dpf. Scale bar, 1 µm. |
| Gene: | |
|---|---|
| Fish: | |
| Anatomical Terms: | |
| Stage Range: | Prim-5 to Days 14-20 |