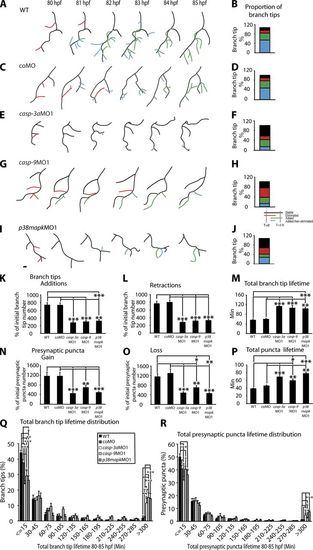
Capase-3, Caspase-9, and p38 MAPK promote RGC axon arbor dynamics. (A, C, E, G, and I) Tracings of arbors at 80–85 hpf expressing YFP-Rab3. Images represent WT (A), coMO (C), casp-3aMO1 (E), casp-9MO1 (G), and p38mapkMO1 (I) morphant arbors every hour during a 5-h time-lapse imaging. All show dorsal views. Black, stable branch tips; red, eliminated tips; green, added tips; blue, tips that were added then eliminated during imaging. (B, D, F, H, and J). The proportion of branch tips in each category. These graphs are derived from analysis of a single arbor in a single experiment. (K and L) Branch tip additions (K) and retractions (L) are shown in the graphs. (N and O) Presynaptic puncta gain (N) and loss (O) are presented as a percentage of initial branch tip or presynaptic puncta, respectively. (M and P) Total branch tip (M) and presynaptic puncta lifetimes (P) include all branch tips or presynaptic puncta present at one or more time points. (Q and R) Total branch tip (Q) and presynaptic puncta lifetime distribution (R) are shown. 9–13 RGC arbors were analyzed per condition. Tracings are dorsal views; anterior is up. Error bars represent SEMs. *, P < 0.05; **, P < 0.01; ***, P < 0.001. Bar, 10 μm.
|
