
Fig. 2
- ID
- ZDB-FIG-150304-24
- Publication
- Campbell et al., 2013 - Local caspase activation interacts with Slit-Robo signaling to restrict axonal arborization
- Other Figures
- All Figure Page
- Back to All Figure Page
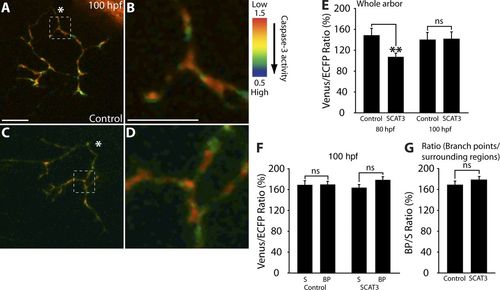
Caspase activity is undetectable in older RGC arbors. (A–D) Representative IMD ratio images of 100-hpf live RGC arbors in the optic tectum; caspase activation is represented by the pseudocolors that correspond to the Venus/ECFP ratio (1.5–0.5). Red represents low caspase activation and violet represents high caspase activation. (A–D) Control (A and B) and SCAT3 (C and D) images are presented. The region enclosed by the dashed squares in A and C are magnified in B and D. (E–G) Quantification of Venus/ECFP ratios across the whole arbor for both 80-hpf (E; data as in Fig. 1 S) and 100-hpf (F) arbors at branch points (BP) and surrounding regions (S) presented as a ratio of branch points/surrounding regions (G). White asterisks indicate the parent axon. Dorsal views are shown, and anterior is up. 10–12 RGC arbors were analyzed per condition. Error bars represent SEMs. **, P < 0.01. Bars, 10 μm. |