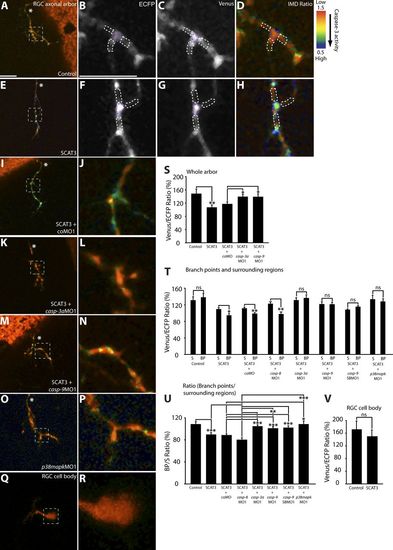
Local caspase activation at branch points in young RGC arbors. (A, D, E, and H–R) Representative IMD ratio images of 80-hpf live RGC arbors in the optic tectum (A, D, E, and H–P) and an RGC cell body (Q and R) in the retina. Caspase activation is represented by the pseudocolors that correspond to the Venus/ECFP ratio (1.5–0.5). Red represents low caspase activation, and violet represents high caspase activation. (A, D, E, and H–P) Control (A and D), SCAT3 (E and H), SCAT3 + coMO (I and J), SCAT3 + casp-3aMO1 (K and L), SCAT3 + casp-9MO1 (M and N), and SCAT3 + p38mapkMO1 (O and P) are shown. (B–D and G) ECFP channel (B and D) and Venus channel (C and G) of SCAT3- and control-expressing arbors are also shown. The region enclosed by the dashed squares in A, E, I, K, M, O, and Q are magnified in B–D, F–H, J, L, N, P, and R. (S) Quantification of Venus/ECFP ratios across the whole arbor. Branch points were determined as covering a distance of 1 μm or less away from where a branch tip joins an arbor. Surrounding regions were determined at a distance of 1 μm away from a branch tip and 2 μm in length, covering the width of the branches. (B–D and F–H) Examples illustrating regions of interest for the quantification of the Venus/ECFP ratio at branch points (purple dashed areas) and surrounding regions (white dashed areas) for control- and SCAT3-expressing arbors, respectively. (T) Quantification of Venus/ECFP ratios at branch points (BP) and surrounding regions (S). (U and V) Presented as a ratio of branch points/surrounding regions (U) and RGC cell bodies (V). White asterisks indicate the parent axon. 19–28 RGC arbors were analyzed in S. 29–36 branch points and 87–108 surrounding regions were analyzed in T and U. 15–16 RGC cell bodies were analyzed in V. Error bars represent SEMs. *, P < 0.05; **, P < 0.01; ***, P < 0.001. Bars, 10 μm. The image in E of a SCAT3-expressing arbor is shown again in Figs. 5 A and S2 C. The magnified image in H also is shown again in Fig. 5 B.
|
