
Fig. 2
- ID
- ZDB-FIG-150122-18
- Publication
- Huang et al., 2013 - Nonmuscle myosin II-B (myh10) expression analysis during zebrafish embryonic development
- Other Figures
- All Figure Page
- Back to All Figure Page
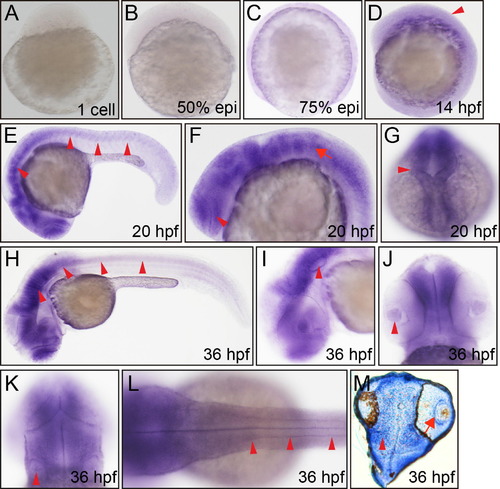
Whole mount in situ hybridization analysis of zebrafish embryos (1 cell–36 hpf) using antisense Danio rerio myh10 probe. (A) 1 cell, lateral view, no hybridization signal. (B) 50% epiboly, lateral view, no hybridization signal. (C) 75% epiboly, lateral view, no hybridization signal. (D) 14 hpf, lateral view, hind brain (arrowhead). (E) 20 hpf, lateral view, central nervous system (arrowheads). (F) 20 hpf, lateral view, eye (arrowhead), rhombomere (arrow). (G) 20 hpf, dorsal view, midbrain (arrowhead). (H) 36 hpf, lateral view, brain and spinal cord (arrowheads). (I) 36 hpf, lateral view, otic vesicle (arrow head). (J) 36 hpf, ventral view, eye (arrowhead). (K) 36 hpf, dorsal view, otic vesicle (arrow head). (L) 36 hpf, dorsal view, spinal cord (arrowheads). (M) Section of 36 hpf head, retina (arrow). |
| Gene: | |
|---|---|
| Fish: | |
| Anatomical Terms: | |
| Stage Range: | 1-cell to Prim-25 |
Reprinted from Gene expression patterns : GEP, 13(7), Huang, Y., Wang, X., Wang, X., Xu, M., Liu, M., and Liu, D., Nonmuscle myosin II-B (myh10) expression analysis during zebrafish embryonic development, 265-270, Copyright (2013) with permission from Elsevier. Full text @ Gene Expr. Patterns