
Fig. S2
- ID
- ZDB-FIG-140626-25
- Publication
- Geurtzen et al., 2014 - Mature osteoblasts dedifferentiate in response to traumatic bone injury in the zebrafish fin and skull
- Other Figures
- All Figure Page
- Back to All Figure Page
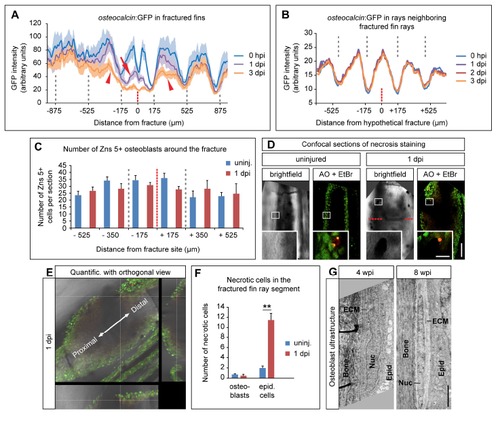
Osteoblasts do not die after fracture and osteocalcin downregulation is not a systemic effect. (A) GFP intensity plot illustrating reduced levels of GFP in the fractured (arrow) and adjacent (arrowheads) segments after injury at 1 and 3 dpi. The grey dashed lines indicate segment boundaries, while the red dashed line indicates the fracture site. Average GFP intensity ± s.e.m. is shown. dpi, day(s) post injury. hpi, hours post injury. (B) osteocalcin:GFP downregulation is not a systemic response. GFP intensity measurements in uninjured fin rays neighboring fractured fin rays reveal that there is no reduction of GFP signal after injury. (C) The number of Zns5+ osteoblasts is not significantly altered at 1 dpi when compared to uninjured fins. Absolute numbers of osteoblasts per longitudinal section in bins of 175 µm along the fractured fin ray are shown. There are no significant differences (Student’s t-test) in the respective uninjured versus 1 dpi groups. Note that 1 fin ray segment is approximately 350 µm long. Error bars, s.e.m. uninj. = uninjured. (D) Confocal (optical section) view of an uninjured versus 1 dpi whole mount fin ray stained for necrotic cells using acridine orange and ethidium bromide Necrotic cells are labeled in both green (acridine orange) and red (ethidium bromide) at the same time. Necrosis of osteoblasts is a rare event both in uninjured and injured fin rays. One necrotic osteoblast in each example is shown in the magnified view. Osteoblasts were identified by their position in the cell layer directly abutting the bone matrix. Scale bar (overview), 50 µm. Scale bar (magnified view), 10 µm. AO = acridine orange. EtBr = Ethidium bromide. (E) Orthogonal view method used for quantification of necrotic cells on confocal (optical) sections. Depending on the location of the necrotic cell either close to the surface (epidermal cell layers) or the deeper bone matrix (osteoblast cell layers) necrotic cells were counted as either epidermal cells or osteoblasts. The example shown here represents a necrotic osteoblast. Quantific. = quantification. (F) Quantification of the experiments depicted in (D) and (E). While osteoblast necrosis is unchanged after fin ray fracture, epidermal cells undergo significantly enhanced necrosis after injury. Error bars, s.e.m. **, p d 0.01, Student’s t-test. (G) Osteoblasts keep a rounded morphology and ultrastructure indicative of bone matrix production for at least 4 weeks post injury, and adopt their original elongated appearance only some weeks later. Electron micrographs of osteoblasts at 4 and 8 wpi. Scale bar, 2 µm. ECM = extracellular matrix, Epid = epidermis, Nuc = nucleus. |