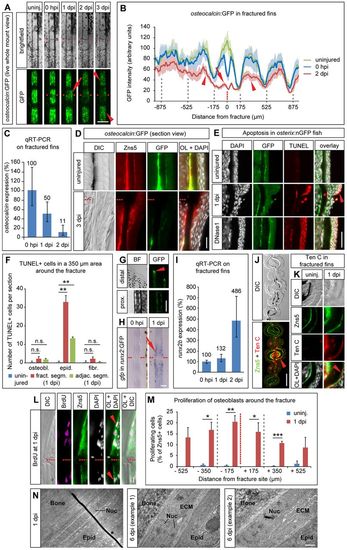
Osteoblasts in the fractured bony fin ray undergo dedifferentiation. (A) Live whole-mount view of a fractured fin ray in the same osteocalcin:GFP transgenic fish imaged at different time points. GFP levels drop in the fractured (arrow) and adjacent (arrowheads) segments. (B) Quantification of osteocalcin:GFP expression showing average GFP intensity±s.e.m. Arrow, fractured segment; arrowheads, adjacent segments. GFP intensity is not reduced by introduction of the fracture, except at the direct fracture site (compare blue curve with green curve). Gray dashed lines, segment boundaries. (C) Endogenous osteocalcin levels determined by qRT-PCR on fractured plus adjacent segments and shown relative to the levels at 0hpi. Error bars, s.d. (D) Longitudinal section view of osteocalcin:GFP uninjured and 3dpi hemirays stained with antibodies against GFP and Zns5. In contrast to uninjured fins, at 3dpi GFP can be hardly detected in Zns5+ osteoblasts. OL, overlay. (E) Apoptotic cells detected by TUNEL staining in longitudinal sections of osterix:nGFP fish are mainly found in the epidermal cell layer overlying the fracture (arrowhead) and only occasionally in osteoblasts (asterisk). DNase1-treated sections were used as positive control. (F) Quantification of experiment shown in E. Error bars, s.e.m. **Pd0.01 Student′s t-test; n.s., not significantly different. (G) GFP expression in uninjured runx2:GFP transgenic fish is largely confined to the distalmost tips of the growing fin rays. prox., proximal. (H) Whole-mount in situ hybridization against gfp in runx2:GFP transgenic fish fin rays at 0hpi and 1dpi reveals induction of transgene expression at the fracture site (arrow). (I) Endogenous runx2b levels determined by qRT-PCR on fractured rays plus adjacent segments and normalized to the level at 0hpi. Error bars, s.d. (J) Anti-Tenascin C and Zns5 antibody staining on cross-sections of three bony fin rays, the central ray of which had been fractured a day earlier. Tenascin C expression is present in osteoblasts and fibroblasts of the fractured fin ray (arrowhead) and extends into the fibroblast population of the interray (asterisks). (K) Magnified view of staining as in J. (L) Zns5+ osteoblasts in the proximity of the fracture incorporate BrdU (arrowheads). Longitudinal sections. (M) Quantification of experiment shown in L. BrdU+ Zns5+ cells were counted in bins of 175µm. Gray dashed lines, segment boundaries. Error bars, s.e.m. *Pd0.05. **Pd0.01. ***Pd0.001, Student′s t-test. (N) Osteoblasts change their ultrastructure upon injury, determined by TEM. ECM, extracellular matrix; Nuc, nucleus/nuclei. *, artefact from staining procedure. Scale bars: 200µm in A,G; 20µm in D; 50µm in E,H; 100µm in J; 10µm in K,L; 1µm in N.
|
