
Fig. 5
- ID
- ZDB-FIG-140325-37
- Publication
- Priyadarshini et al., 2013 - Oxidative stress and regulation of Pink1 in zebrafish (Danio rerio)
- Other Figures
- All Figure Page
- Back to All Figure Page
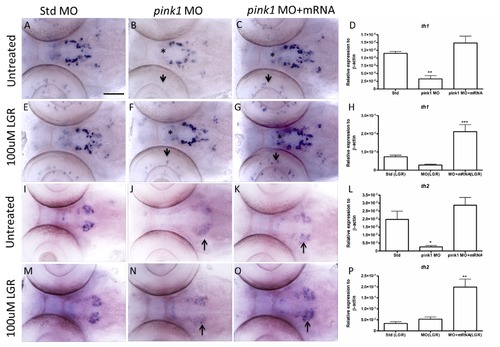
Expression levels of th1 and th2 mRNA at 3 dpf in pink1 morphants untreated and treated with LGR. A-C. Altered th1 expression in the untreated std ctrl MO, pink1MO, and pink1MO+mRNA groups. A decrease in th1 expression in the population 5,6,11 (*) in morphants (B) was observed as compared to the ctrl MO group (A). The expression could be rescued by pink1 mRNA co-injection (C). D. Representative quantitative graph for the untreated group. E-G. The expression of th1 ISH in LGR-treated groups. The drug LGR rescued the reduced th1 cells in the eyes and also group 5,6,11 of the morphants (E) as compared to the ctrl MO group (D). The expression is enhanced in the rescue group with the combined effect of LGR and pink1 mRNA (F). H. Graphical representation of the transcript levels for th1 in the LGR-treated group. A significant change in the pink1 mRNA co-injected group. I-K. The expression of th2 ISH in the untreated std MO, pink1MO, and pink1MO+mRNA groups. A loss of th2 was observed in group 10b in the pink1 morphants (H) as compared to ctrl MO (G). The pink1 mRNA rescued th2 expression in group 10b (I). L. The representative th2 transcript levels determined by q-RT-PCR for the untreated group. M-O. The expression of th2 ISH in LGR treated groups. LGR-treated pink1 MO shows a slight increase in the th2 10b group (K) as compared to ctrl MO (J). The pink1 mRNA along with LGR completely rescues the loss of th2 in the 10b cell group (L). P. Representative q-RT-PCR results for the th2 LGR-treated group. A significant change in the pink1 mRNA co-injected group together with LGR significantly increased the th2 transcript levels. Figures D and L present confirmation of th1 and th2 transcripts downregulation in the pink1 morphants. Figures H and P present the additive rescue effect of LGR together with pink1 mRNA on the morphants. The Bonferroni Hochberg multiple comparison statistical test was applied for the q-RT-PCR results (* p < 0.05, ** p < 0.01, *** p < 0.001). ISH – in-situ hybridization, LGR – L-glutathione reduced, MO – morpholino oligonucleotides, pink1 – PTEN-induced putative kinase 1, q-RT-PCR – quantitative real-time PCR, th1 – tyrosine hydroxylase1, th2 – tyrosine hydroxylase 2. Scale bar represents 100 μm. |
| Genes: | |
|---|---|
| Fish: | |
| Condition: | |
| Knockdown Reagent: | |
| Anatomical Terms: | |
| Stage: | Protruding-mouth |