|
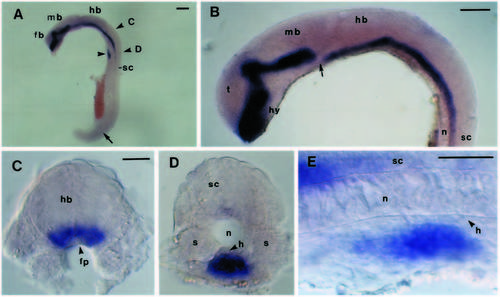
nk2.2 expression in the hindbrain and in a group of cells ventral to the notochord. Lateral views (A,B,E) with rostral to the left and transverse sections (C,D) of 20-22 somites (19-20h) embryos from which the eyes and yolk have been removed. The alkaline phosphatase colour reaction was developed 5-6 times longer than usual to reveal weak expression. The approximate levels of the sections shown in C and D are indicated in A. (A) Low magnification view of the entire embryo. The arrow indicates very faint staining in the caudal spinal cord, and the arrowhead points to the group of cells shown in D and E. (B) nk2.2 expression in the brain. The arrow indicates the discontinuity in the band of nk2.2-expressing cells. (C) Transverse section through the caudal hindbrain revealing expression in cells adjacent to the floorplate. (D) Transverse section near the hindbrain/spinal cord junction showing nk2.2 expression in cells beneath the notochord and hypochord (arrow). (E) Lateral view of the same group of cells as (D). Abbreviations: fb, forebrain; fp, floorplate; h, hypochord; hb, hindbrain; hy, hypothalamus; mb, midbrain; n, notochord; s, somite; sc, spinal cord; t, telencephalon. Scale bar: A,B=100 μm, C-E=20 μm.

|
