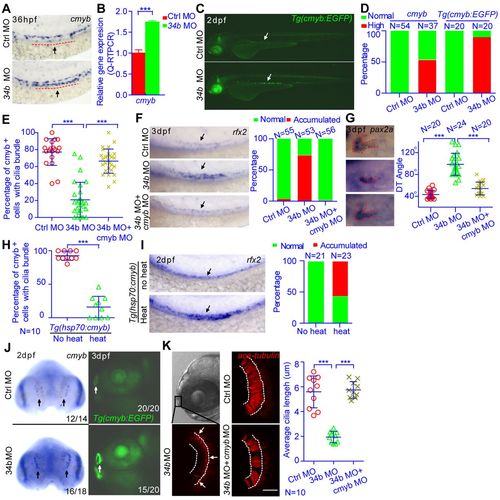
miR-34b regulates multiciliogenesis and kidney morphogenesis through cmyb. (A) WISH analysis of cmyb expression at 36 hpf. The arrow and dashed line show the region of MCCs. (B) QRT-PCR analysis of cmyb expression in MCCs that were isolated from 3-dpf Tg(cmyb:EGFP) embryos by flow cytometry. The expression level was normalized to that of β-actin 1. (C) A 2-dpf Tg(cmyb:EGFP) embryo shows enhanced fluorescence in MCCs (arrow) after miR-34b knockdown. (D) Statistical analysis of A and C showing normal versus high expression of cmyb. (E) The percentage of cmyb:EGFP+ cells with cilia bundles was calculated for each embryo and analyzed statistically at 36 hpf. (F,G) A magnified lateral view of 3-dpf embryos after in situ hybridization with rfx2 or pax2 probe shows the distribution of MCCs and the state of proximal tubule convolution. Arrows (F) indicate rfx2+ MCCs. The DT angle was measured. (H) The percentage of cmyb:EGFP+ cells with cilia bundles was calculated for each Tg(hsp70:cmyb) embryo and analyzed statistically at 36 hpf (I) A magnified lateral view of 2-dpf Tg(hsp70:cmyb) embryos after in situ hybridization with rfx2 probe shows the distribution of MCCs. Arrows indicate rfx2+ MCCs. The percentage of embryos with accumulated rfx2+ MCCs (Accumulated) in F and I was calculated. (J) WISH analysis of cmyb expression at 2 dpf in the olfactory placode (arrows). A representative image of a 3-dpf Tg(cmyb:EGFP) embryo shows enhanced fluorescence of the olfactory placode (arrows) after miR-34b knockdown. The number of embryos with normal (top pictures) or high expression level (bottom pictures) of cmyb among all analyzed embryos is indicated (bottom right). (K) The ciliary (anti-acetylated-tubulin staining, red) morphology of the olfactory placode at 3 dpf in normal embryos, miR-34b morphants and embryos injected with both miR-34b MO and cmyb MO. Cilia length was analyzed at three positions (arrows) for each embryo, and the average cilia length is listed. Each circle/triangle/cross represents an embryo. Mean ± s.d. ***P<0.0001 (unpaired t-test). Scale bar: 10 μm.
|
