|
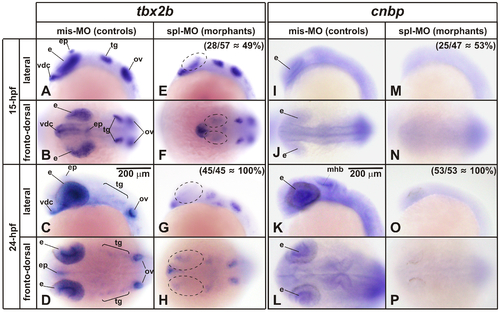
CNBP depletion reduces the expression of tbx2b in territories overlapping with cnbp. Expression pattern of tbx2b and cnbp analyzed by whole-mount in situ hybridization in 15 and 24-hpf-staged zebrafish embryos microinjected with mis-MO (A–D and I–L) or spl-MO (E-H and M–P) morpholinos. Anterior is at the left. Scale bar (200 μm) is represented in C and K. Tbx2b expression territories affected in morphant embryos are marked with dashed-line ovals. Number and percentages of morphant phenotypes are indicated for each embryo stage. Cnbp expression pattern in control embryos (microinjected with mis-MO) is coincident with that described elsewhere [4] and mainly overlapping with tbx2b expression in the eye territory. Morphant embryos showed a dramatically reduced cnbp expression level in those territories wherein it is normally expressed. vdc, ventral diencephalon; e, eye; ep, epiphysis; mhb, midbrain–hindbrain border; ov, otic vesicle; tg, trigeminal ganglion.
|