
Fig. S3
- ID
- ZDB-FIG-110804-9
- Publication
- Murphy et al., 2011 - A Src-Tks5 Pathway Is Required for Neural Crest Cell Migration during Embryonic Development
- Other Figures
- All Figure Page
- Back to All Figure Page
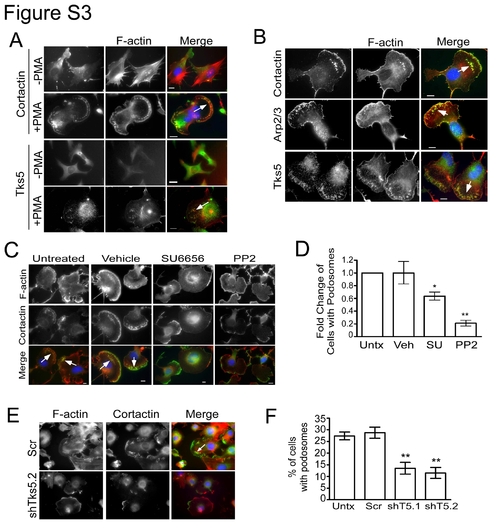
Neural crest stem cells form podosomes. (A) JOMA1.3 cells were stained for F-actin (phalloidin) and either cortactin or Tks5 in the presence and absence of PMA (25 ng/ml) to identify formation of podosomes (arrow). (B) PMA-stimulated (25 ng/ml) JOMA1.3 cells were immunostained for F-actin (using phalloidin) and the podosome markers cortactin, Arp2/3, and Tks5. (C–D) Vehicle (DMSO) or SFK inhibitors (SU6656 and PP2) were added to JOMA1.3 cells prior to PMA stimulation. (C) Analysis of podosome formation was conducted by immunostaining for F-actin (phalloidin) and cortactin (arrows). (D) The total number of cells with podosomes was quantified for each treatment group and analyzed as fold change of cells with podosomes compared to untreated cells. Mean values (n = 3) and SEM were shown in graph. p values obtained from Student′s t-test. * denotes p<0.05 for untreated vs. SFK treated comparison; ** denotes p<0.01 for untreated vs. SFK treated comparison. (E–F) PMA-treated control (uninfected and scrambled shRNA) and Tks5 knockdown (shT5.1, and shT5.2) cells were stained for F-actin (phalloidin) and cortactin to identify formation of podosomes. (F) Percentage of cells possessing podosomes was calculated as previously described. Mean values (n = 3) and SEM are shown in graph. ** denotes p<0.01 for scrambled versus shT5.1 and shT5.2. p values obtained from Student′s t-test. In all cases, the white arrows point to clusters of podosomes. |