
Fig. 5
- ID
- ZDB-FIG-110804-7
- Publication
- Murphy et al., 2011 - A Src-Tks5 Pathway Is Required for Neural Crest Cell Migration during Embryonic Development
- Other Figures
- All Figure Page
- Back to All Figure Page
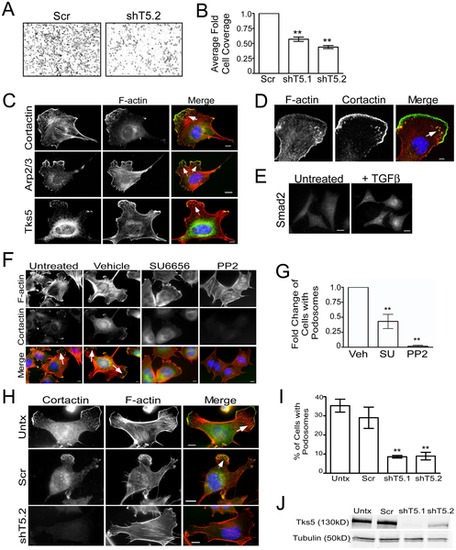
Migration of, and podosome formation in, neural crest stem cells requires Tks5. (A–B) Control (Scr) and Tks5 knockdown (shT5.1 and shT5.2) JOMA1.3 cells were exposed to a TGFβ gradient using the transwell migration assay. The number of migrating cells was qualitatively analyzed in each group (A) and quantified as described in Materials and Methods (B). Mean values (n = 3) and SEM were shown in graph. ** denotes p<0.01. (C) TGFβ-stimulated (25 ng/ml) JOMA1.3 cells were immunostained for F-actin (using phalloidin) and the podosome markers cortactin, Arp2/3, and Tks5 to identify formation of podosomes (arrows). In all cases, scale bars represent 10 μm and white arrows point to clusters of podosomes. (D) Confocal microscopy of TGFβ-stimulated JOMA1.3 cells co-stained for F-actin (using phalloidin) and cortactin. (E) JOMA 1.3 cells were treated with TGF-β and stained for SMAD2 by immunofluorescence to confirm activation of TGF-β-dependent pathways. (F–G) Vehicle (DMSO) or SFK inhibitors (SU6656 and PP2) were added to JOMA1.3 cells prior to TGF-β stimulation followed by analysis of podosome formation by immunostaining for F-actin (phalloidin) and cortactin (arrows). (G) The total number of cells with podosomes was quantified for each treatment group and analyzed as fold change of cells with podosomes compared to untreated cells. Fold change of cells was compared to vehicle treated cells. Mean values (n = 3) and SEM were shown in graph. ** denotes p<0.01 for vehicle vs. SFK treated comparison. (H–J) Tks5 was knocked-down in JOMA1.3 cells by two independent shRNA constructs [shTks5.1 (shT5.1), shTks5.2 (shT5.2)]. (H) Untreated, control (scrambled shRNA), and Tks5 knockdown cells were stimulated with TGFβ for 5 hours and stained for F-actin and cortactin to identify podosomes. (I) The percentage of cells with podosomes was quantified (as described in Materials and Methods. Mean values (n = 3) and SEM are shown. p values obtained from Student′s t-test. ** denotes p<0.01. (J) Tks5 knockdown was confirmed by immunoblot analysis for Tks5 using whole cell lysates and anti-Tks5 antibody. Protein levels were normalized to tubulin. |