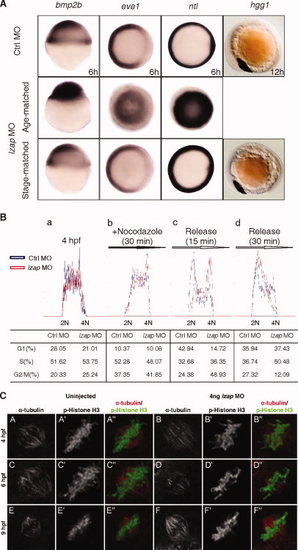
Depletion of Lzap causes delay in cell cycle progression but does not disrupt zygotic gene expression after midblastula transition (MBT). A: The expression of bmp2b, eve1, ntl, and hgg1 in control and both age-matched and stage-matched lzap morphant embryos were detected by whole-mount in situ hybridization. bmp2b expression, lateral view, 6 hours postfertilization (hpf) in control. eve1 and ntl expression, top view, 6 hpf in control. hgg1 expression, lateral view, 12 hpf in control. B: Cell cycle analyses of dissociated zebrafish embryonic cells. DNA content was determine on untreated embryonic cells (a), on cells treated with 10 μg/ml nocodazole for 30 min (b), or on cells treated with nocodazole followed by release for 15 (c) or 30 min (d). Cells were assigned to G1, S, or G2/M based on fluorescent signal and manual gating using CellQuest Pro software. Results in the table represent the mean of at least three independent experiments. C: Embryos with and without injection of 4 ng of lzap morpholino (MO) were co-immunostained with anti–α-tubulin (red) and p-Histone H3 (green) antibodies at 4, 6, and 9 hpf in mitotic cells. Results are representative of observations from more than 100 nuclei for each panel.
|
