
FIGURE
Fig. S7
Fig. S7
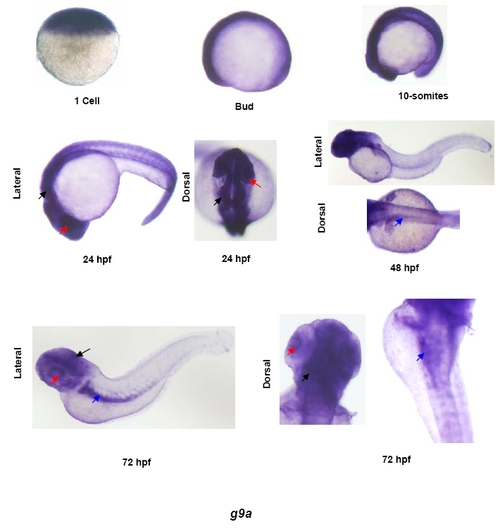
Expression pattern of g9a in developing zebrafish embryos. Whole mount in situ analysis of g9a expression in different stages of zebrafish development. Shown here are 1-cell, bud, 10-somites, 24hpf, 48hpf and 72hpf stages. For first three stages only lateral views are shown whereas for last three time points dorsal and lateral images are shown to depict tissue-specific expression. Black arrows show expression in brain, red arrows denote expression in the eye and blue arrows point to the expression in the gut. |
Expression Data
| Gene: | |
|---|---|
| Fish: | |
| Anatomical Terms: | |
| Stage Range: | 1-cell to Protruding-mouth |
Expression Detail
Antibody Labeling
Phenotype Data
Phenotype Detail
Acknowledgments
This image is the copyrighted work of the attributed author or publisher, and
ZFIN has permission only to display this image to its users.
Additional permissions should be obtained from the applicable author or publisher of the image.
Open Access.
Full text @ J. Biol. Chem.