
Fig. S6
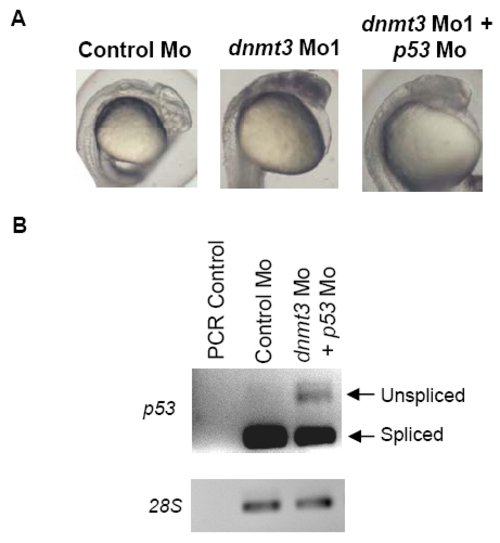
Dnmt3 morphants show abnormal brain structure. (A) Bright light image of dnmt3 and control morphants at 24hpf shows that brain structure was not formed correctly. Note that Control morphants are transparent and internal structures can be seen whereas dnmt3 morphants are filled with black spots which depict cells undergoing apoptosis or necrosis. Embryos co-injected with dnmt3 morpholino and p53 morpholino together show reduced cell death. (B) p53 morpholino knockdown. PCR was performed on cDNA made from embryos injected with control morpholino or p53 morpholino and dnmt3 morpholino at 24hpf. Unspliced and spliced DNA length for p53 is shown by arrows. |