
FIGURE
Fig. S4
Fig. S4
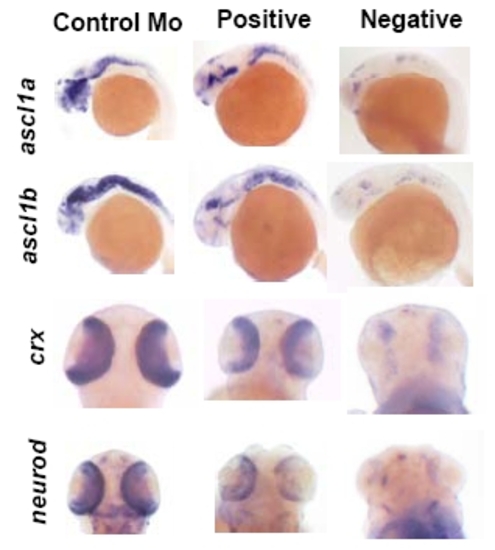
Examples of positive and negative staining. Examples of embryos counted as positive or negative is shown for ascl1a, ascl1b, crx and neurod. |
Expression Data
Expression Detail
Antibody Labeling
Phenotype Data
Phenotype Detail
Acknowledgments
This image is the copyrighted work of the attributed author or publisher, and
ZFIN has permission only to display this image to its users.
Additional permissions should be obtained from the applicable author or publisher of the image.
Open Access.
Full text @ J. Biol. Chem.