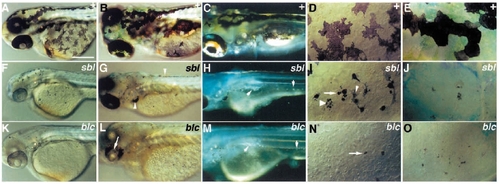
Phenotypes of mutations affecting pigmentation of all chromatophores (Class VI.H). Wild-type siblings (A-E) are compared with homozygous mutants for sbl (F-J) and blc (K-O) on the third day (A,D,F,I,K,N) and the sixth day (B,C,E,G,H,J,L,M,O). Melanophore degeneration begins early (F,I,K,N) and pale (small arrowhead, I), spot-like (arrows, I,N) and fragmenting (large arrowhead, I) melanophores are seen. Melanophore degeneration phenotypes are extreme by the sixth day (G,J,L,O), numbers appear strongly decreased (G,L) and collect abnormally (arrowheads, G). In sbl the eye is small and pale (F), whereas in blc the pigmented retinal epithelium is pale on the third day (K) and largely degenerated by the sixth day (arrow, L). Xanthophores are very pale (F,G,J) or almost unpigmented (K,L,O). Iridophores are dull (arrows, H,M). Panels C,H and M were photographed with incident light. A-C, F-H and K-M are dorsolateral views; D,I and N are dorsolateral views of melanophores on the yolk sac; E,J and O show dorsal views of the head dorsal stripe. Scale bars, 250 μm (A-C,F-H,K-L) and 60 μm (D,E,I,J,N,O).
|
