|
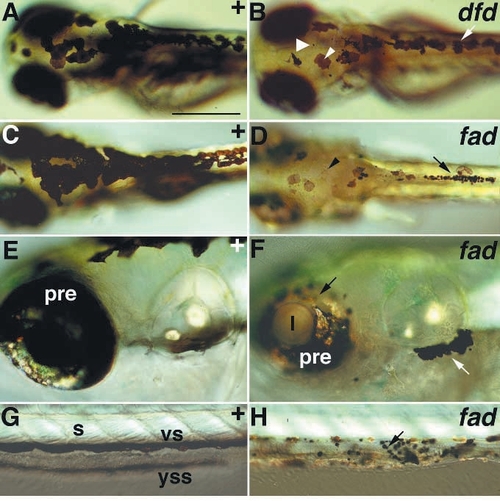
Melanophore degeneration phenotypes (Class VI.C). Wild-type siblings are compared with homozygous mutants for dfd on the fourth day (A,B), and fad on the sixth day (C-H). Abnormal melanophores are first seen mixed in with normal ones (arrow, B) on the fourth day in dfd, as both large, pale cells (small arrowhead, B) and small spots (large arrowhead, B). Abnormal melanophores are first seen on the third day in fad, and by the sixth day the majority are abnormal, being either small and spot-like (arrow, D), pale or apparently fragmented (arrowhead, D). Spot-like melanophores collect abnormally, in piles in the dorsal stripe (arrow, D), in collections ventrolateral to the ear (white arrow, F) and on the hindgut (arrow, H). In fad the pigmented retinal epithelium depigments (D,F) and the eye degenerates (note small size in D,F), although the lens remains normal (F). Abbreviations as Fig. 2; s, somite; l, lens. Scale bars, 350 μm (A-D), 200 μm (E,F) and 125 μm (G,H).
|