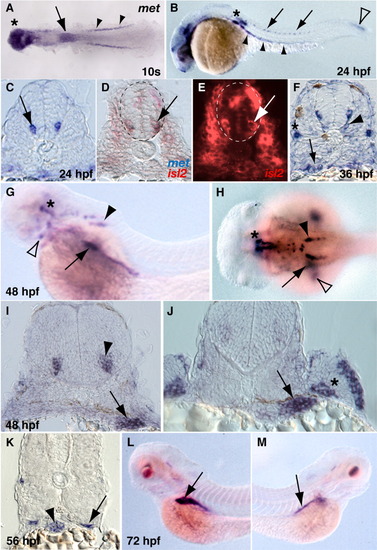
c-met expression from somitogenesis-stages through 72 hr. A: Flat-mounted embryo at 14 hr (10 somite-stage), anterior is to the left. Note expression in the pronephric ducts (arrowheads), presumptive forebrain (asterisk), and anterior spinal cord (arrow). B: Whole-mount, lateral view showing c-met in neural tube cells (arrows), pronephric ducts (arrowheads), posterior lateral line primordium (asterisk), and posterior spinal cord (open arrowhead). C-F: Transverse sections through the trunk, dorsal is to the top. C: c-met expression in neural tube (arrow) at 24 hr. D,E: c-met in blue and isl2 in red. The same cell (arrows) is labeled by each probe. F: c-met expression in the pronephric ducts (arrow) and cells adjacent to the ventral neural tube (arrowhead) at 36 hr. The asterisk denotes lateral line expression. G: Forty-eight-hour, whole-mount, lateral view showing c-met in the fin bud and liver (arrow), hindbrain (black arrowhead), diencephalon (asterisk), and parathyroid (open arrowhead). H: Forty-eight-hour, whole-mount, dorsal view showing expression in the hindbrain (black arrowhead), liver (arrow), diencephalon (asterisk), and fin bud (open arrowhead). I: Forty-eight-hour transverse section showing c-met in the liver (arrow) and hindbrain (arrowhead). J: Transverse section at a slightly more posterior level than I showing expression in the liver (arrow) and fin bud (asterisk). K: Fifty-six-hour transverse section, further posterior than sections in I and J, showing c-met in the pronephric ducts (arrow) and gut (arrowhead). Lateral views of c-met expression in the liver (L) and pancreas (M) of a 72-hr embryo. Embryos in G, H, L, and M were treated with PTU to reduce pigment.
|
