|
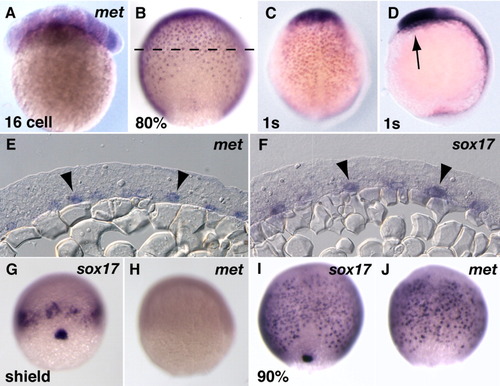
c-met expression in early endodermal cells. A: Whole-mount embryo (1.5 hr, 16 cell-stage) probed for c-met transcripts. The animal pole is to the top. B,C: Whole-mount, dorsal views at (B) 9 hr (80% epiboly) and (C) 10.5 hr (1 somite-stage) showing expression in presumptive endodermal cells. D: Lateral view at 10.5 hr showing additional expression in the anterior neuroectoderm (arrow). E,F: Transverse sections of 9-hr embryos (approximately at the plane of the dashed line in B) showing c-met (E) and sox17 expression (F) in presumptive endodermal cells (arrowheads). G-J: Whole-mount, dorsal views of stage-matched embryos from the same clutch probed for sox17 and c-met. The animal pole is to the top. G: sox17 expression in mesendodermal cells near the blastoderm margin and in forerunner cells at 6 hr (shield-stage). H: c-met expression is not visible at the same stage. I,J: c-met and sox17 expression in presumptive endodermal cells at 8.5 hr (late gastrulation).
|