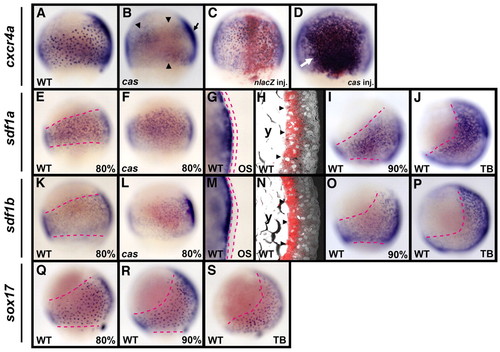
During gastrulation in zebrafish, cxcr4a is expressed in the endoderm, and sdf1a and sdf1b are expressed in the mesoderm. (A-D) cxcr4a expression was examined by whole-mount in situ hybridization in cas mutant embryos and embryos injected with either cas or nlacZ mRNA at the 80% epiboly stage (8.3 hpf). Lateral views, dorsal to the right (A,B), and dorsal views, anterior to the top (C,D). The salt-and-pepper endodermal expression of cxcr4a is absent in the cas mutant, whereas expression in others tissues is still detectable on the dorsal side (arrow in B) and is faintly detectable (arrowheads in B) in other regions of the cas mutant. Although the overexpression of nlacZ mRNA does not affect the salt-and-pepper expression of cxcr4a, cas mRNA injection increases the number of cxcr4a-expressing cells (arrow in D). (E-P) sdf1a and sdf1b expression was examined in wild-type (WT) and cas mutant embryos. Lateral views with dorsal to the right (except for G,H,M,N). (E,F,K,L) At the 80% epiboly stage, neither sdf1a nor sdf1b expression is altered in the cas mutant embryos. (G,M) Optical cross-sections (OS) of 80% epiboly stage embryos show that expression of both sdf1a and sdf1b is present in the hypoblast layer, but not in the epiblast layer (the epiblast layer is indicated by the red dashed lines). Dorsal views, anterior to top. (H,N) Confocal images of sagittal sections of 80% epiboly stage embryos by confocal laser-scanning reflection microscopy (Jékely and Arendt, 2007). Expression of both sdf1a and sdf1b (red) is restricted to the hypoblast layer (arrowheads). y, yolk. (I,J,O,P) The expression of sdf1a and sdf1b in WT embryos at 90% epiboly (9 hpf) and tail bud (TB; 10 hpf) stages. As gastrulation proceeds, both sdf1a- and sdf1b-expressing cells move to the dorsal side of the embryo. (Q-S) sox17 expression in endodermal cells at 80% epiboly, 90% epiboly and TB stages in WT embryos. Lateral views, dorsal to the right. The regions of sox17-expressing endodermal cells from 80% epiboly to TB stages (red dashed lines in Q-S) are comparable to those of sdf1a- and sdf1b-expressing cells (red dashed lines in E,I,J,K,O,P).
|
