
Fig. 1
- ID
- ZDB-FIG-080604-37
- Publication
- Chi et al., 2008 - Genetic and Physiologic Dissection of the Vertebrate Cardiac Conduction System
- Other Figures
- All Figure Page
- Back to All Figure Page
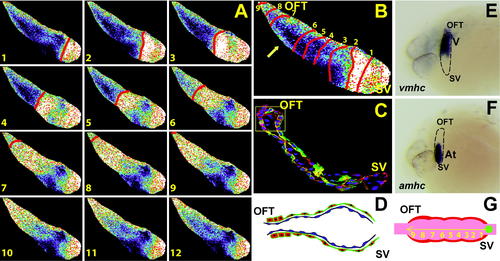
Cellular and In Vivo Electrophysiologic Analysis of 24 hpf Wild-Type Hearts (B) A 24 hpf optical map of calcium excitation represented by isochronal lines every 60 ms. Slow linear conduction with no significant delays is observed across the 24 hpf heart tube with increased conduction velocity over the presumptive ventricle (arrow). (C) Tg(cmlc2:eGFP-ras)s883 (green) embryos at 24 hpf are stained with rhodamine phalloidin (red) and TOPRO (dark blue). The heart is a linear tube, and cardiomyocytes uniformly have a squamous shape except at the OFT (yellow box) where they have become cuboidal. (D) Schematic representation of the heart shown in (C). Myocardium is in red. Endocardium is in blue. (E and F) In situ analysis of 24 hpf embryos reveals molecular chamber specification within the heart tube: atrial myosin heavy chain, amhc, and ventricular myosin heavy chain, vmhc. Lateral views. (G) Schematic representation of conduction in 24 hpf heart. Numbers indicate temporal sequence of calcium activation in the heart. Yellow arrow indicates direction of cardiac conduction. Green circle indicates slow conduction pathway/pacemaker activity. SV, sinus venosus; V, ventricle; At, atrium. |
| Genes: | |
|---|---|
| Fish: | |
| Anatomical Terms: | |
| Stage: | Prim-5 |
| Fish: | |
|---|---|
| Observed In: | |
| Stage: | Prim-5 |