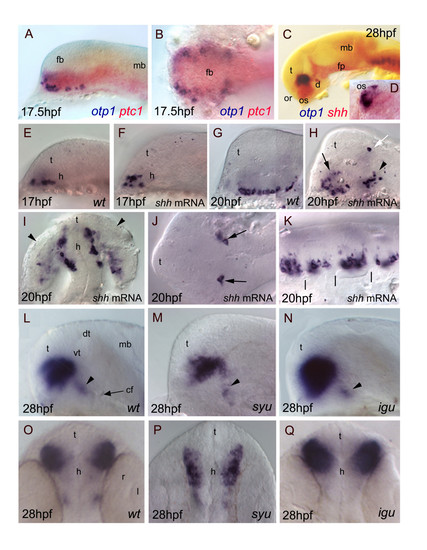
Relationships between otp1 and HH signaling in the diencephalon. Anterior is to the left in all panels except for D, I, O-Q where anterior is up. The latter panels, B and J are dorsal images, while the remaining ones are lateral views.A-D, Relative distribution of otp1 and shh signaling factors, i.e. shh and its receptor patched-1 (ptc1). A, B, Co-staining of ptc1 (red) and otp1 (blue) mRNAs at 17.5 hpf stage reveals that otp1 expression is included in the shh-pattern, where they are placed at the ventrolateral margins. C, D, Likewise, double labelling of shh (red) and otp1 (blue) at 28 hpf shows coexpression near the optic stalks, as seen in the close-up (D). E-K, Overexpression of synthetic shh mRNA at 1–2 cell stage induces dorsalization of otp1 positive cells. E, F, Since early otp1 expression, forced shh expression induces an initial dorsal displacement at the rostral edge of the diencephalon, without significant alteration of cell number (17 hpf). G, H, A comparable number of otp1 positive cells in both the PO (arrow) and the PT (arrowhead) are dorsalized at later stages of brain development (20 hpf). I, shh overexpressing embryos shown in H display abnormal expression in the optic vesicle (arrowheads). J, In addition, ectopic expression of otp1 is consistently found in two symmetrical cells in the dorsal thalamus (open arrow in H, arrows in J). K, The repeated pattern of otp1 expression in the hindbrain is maintained, but it now appears as a single median cluster per each rhombomere, and it does not extends dorsally (vertical dashes correspond to rhombomere boundaries; compare with Fig. 4E, F-H). L-Q, otp1 expression in 28 hpf zebrafish mutants lacking shh (syu) and the HH-inhibitor Dzip-1 (igu). Labelling of PO cells indicates that the size of the otp1 cluster is (M, P) reduced in syu and (N, Q) enlarged in igu as well, if compared with (L, O) control embryos. In both mutants, no significant alteration of the otp1 cluster in PT is observed (arrowheads in L-N). cf, cephalic flexure; d, diencephalon; dt, dorsal thalamus; fb, forebrain; fp, floor plate; mb, midbrain; l, lens; or, optic recess; os, optic stalks; r, retina; t, telencephalon; vt, ventral thalamus.
|
