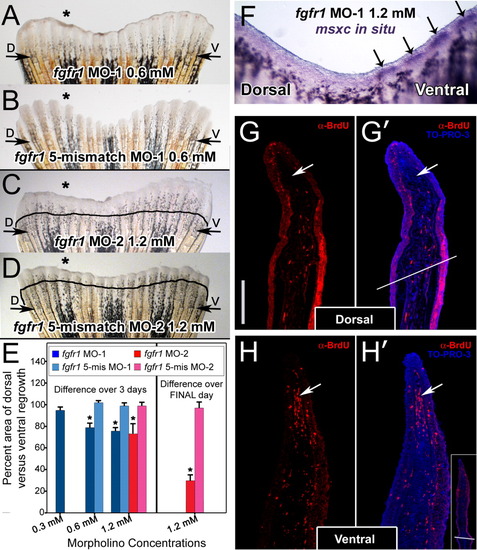
Injection and in vivo electroporation of fgfr1 morpholinos. A: Fin electroporated with 0.6 mM fgfr1 morpholino (fgfr1 MO-1). B: Fin electroporated with 0.6 mM of the corresponding fgfr1 5-mismatch morpholino. C: Fin electroporated with 1.2 mM of a second fgfr1 morpholino (fgfr1 MO-2). D: Fin electroporated with 1.2 mM of the corresponding fgfr1 5-mismatch morpholino. E: Graph comparing areas of outgrowth of dorsal (experimental) and ventral (control) sides at 72 hpa. On the left, bars depict the percent area of dorsal versus ventral re-growth as calculated over the entire 72 hpa. On the right is the second 1.2 mM experiment for which percent inhibition only over the final 24 hr of outgrowth was calculated. The asterisks in E denote a significant difference in outgrowth compared to fins injected with the corresponding concentration of the appropriate 5-mismatch control morpholino (P less than or equal to 0.005). At least five fins were examined for each concentration of morpholino. F: Wholemount RNA in situ hybridization of a fin electroporated with 1.2 mM of fgfr1 morpholino exhibiting an absence of msxc expression only on the dorsal (experimental) side of the fin. Arrows point to msxc expression in the blastemas of the ventral (control) side of the fin. G, G′, H, H′: Representative sections of dorsal (G, G′) and ventral (H, H′) blastemas from a 1.2-mM fgfr1 morphant fin demonstrating reduced BrdU incorporation (red cells) in dorsal blastemas. G′ and H′ have been co-labeled with TO-PRO-3 (blue), a nuclear stain. White arrows point to the blastema. Note the presence of a fewer number of positive cells in this region in the dorsal (experimental) side of the fin shown in G and G′ compared to the ventral (control) side of the fin shown in H and H′. In G′, the white line bisecting the section marks the cut site. Similarly, the inset in H′ shows a lower magnification image of the fin in H′ demonstrating the cut site. The vertical scale bar in G, representative for G - H′, is 150 μm.
|
