
- Title
-
Genetic suppression features ABHD18 as a Barth syndrome therapeutic target
- Authors
- Masud, S.N., Srivastava, A., Mero, P., Echezarreta, V.S., Anderson, E., van Buren, L., Wei, J., Taylor, D.T., Farias, A.G., Mikolajewicz, N., Shaw, A., Murareanu, B.M., Lohbihler, M., Carney, O.S., van Heeringen, S., Clijsters, L., Sizova, O., van Ameijde, J., Nye, F., Habsid, A., Nedyalkova, L., McDonald, L., Simpson, C., Wybenga-Groot, L., Brown, K.R., Nho, N., Suciu, R.M., Chan, K., Tong, A.H.Y., Vaz, F.M., Evers, B., Lesurf, R., Papaz, T., Nutter, L.M.J., Protze, S., Billmann, M., Costanzo, M., Andrews, B.J., Myers, C.L., Mital, S., Vernon, H., Brummelkamp, T.R., Boone, C., Scott, I.C., Niphakis, M.J., Strathdee, D., Nijman, S.M.B., Blomen, V.A., Moffat, J.
- Source
- Full text @ Nature
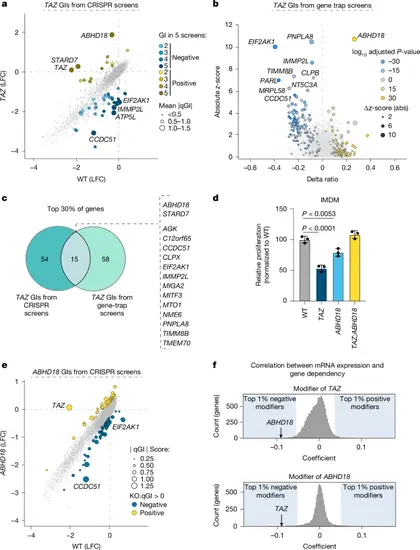
Genetic screens identify ABHD18 as a suppressor of TAZ-mutant fitness defects. a, Scatterplot depicting the genetic effects resulting from pooled CRISPR screens in HAP1 wild-type (WT, n = 39) and TAZ-KO (n = 5, clones 1 and 2) cells plotted as log2-transformed fold change (LFC) values and scaled by quantitative GI (qGI) score. Significant GIs are labelled (mean |qGI | > 0.5, false discovery rate (FDR) < 0.1 n = 5 screens). The node size corresponds to the mean absolute qGI score. b, Scatterplot of viability data from gene-trap mutagenesis screens consisting of two TAZ-KO maps (n = 2) compared with WT controls (n = 4). The Δ(ratioTAZ − ratioWT) is the differential ratio between TAZ-KO and WT cells. The z-score represents the standardized effect size of the TAZ-KO screens compared with a reference of 39 public maps. Significance was determined by Fisher’s exact test (TAZ-KO versus WT; Padj < 0.05) and a binomial test (adjusted P (Padj) < 0.05; TAZ-KO sense versus antisense). The top significant hits are shown. c, Venn diagram showing the overlap of TAZ genetic modifiers (positive and negative) between orthogonal screening methods. The top 30% of genes from each screen were included, ranked by combined qGI and FDR (CRISPR screens) and z-score (gene-trap screens). e, Scatterplot of ABHD18 negative and positive GIs from HAP1 WT (n = 39) and ABHD18-KO (n = 1) pooled CRISPR screens, depicted as in a. d, Bar plot of relative cell proliferation measurements in HAP1 WT, TAZ-KO, ABHD18-KO and TAZ;ABHD18 double-KO cells. Data are presented as mean ± s.d.; n = 3 biological replicates, each performed in technical triplicate with significance (WT versus TAZ, Padj = 0; WT versus ABHD18-KO, Padj = 0.0053) determined by one-way analysis of variance (ANOVA) followed by Dunnett’s post-hoc test. f, Distribution of TAZ (top) and ABHD18 (bottom) genetic modifier likelihood coefficients determined from DepMap data. The top 1% of putative modifiers are shaded. ABHD18 (top) and TAZ (bottom) are indicated. |
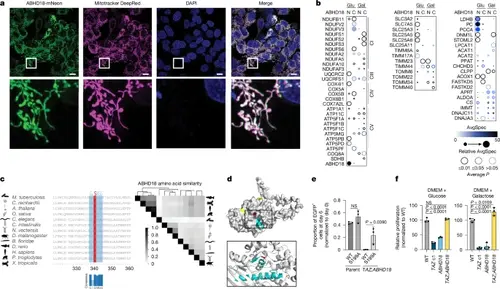
ABHD18 is a putative mitochondrial serine hydrolase. a, Live-cell fluorescence microscopy of HAP1 cells expressing mNeon-tagged ABHD18 (n = 1). Top, mitochondria are stained with Mitotracker DeepRed (purple) and nuclei with DAPI (blue). Bottom, expanded views of the areas in the white square. Scale bars, 10 μm. b, Dot plots of miniTurbo-tagged (at the amino or carboxy terminus) ABHD18 grown in either glucose or galactose and assessed by BioID (n = 3 biological replicates). AvgSpec, average spectral count. c, Sequence alignment of ABHD18 orthologues from Mycobacterium tuberculosis, Chlamydomonas reinhardtii, Arabidopsis thaliana, Oryza sativa, Caenorhabditis elegans, Ciona intestinalis, Nematostella vectensis, Drosophila melanogaster, Branchiostoma floridae, Danio rerio, Homo sapiens, Pan troglodytes and Xenopus tropicalis (left). The canonical serine hydrolase motif is highlighted in blue, with the conserved serine residue in red. The heatmap shows amino acid sequence similarity between ABHD18 orthologues determined by Clustal Omega (right). Similarity profiles were hierarchically clustered. d, Predicted Alphafold structure of ABHD18 with a putative catalytic site containing a serine residue (red). Exon 8 sequences are highlighted in cyan and the N and C termini are yellow. e, Competitive growth assay of HAP1 cell lines expressing ABHD18(WT)–eGFP or catalytic dead ABHD18(S199A)–eGFP. The indicated lines were co-cultured with HAP1 WT–Cherry and quantified by flow cytometry over 6 days. Bar plots show the eGFP+ proportion normalized to day 0. Data are presented as mean ± s.d. of n = 3 biological replicates, with significance determined by one-way ANOVA followed by Tukey’s multiple-comparisons test. f, Proliferation assay comparing single TAZ-KO (Padj = 0), ABHD18-KO (Padj = 0) and double-mutant TAZ;ABHD18 double-KO (Padj = 0.0109) in GAL effects in glucose-supplemented (left) or galactose-supplemented (right) DMEM, normalized to the WT. Data are presented as mean ± s.d., n = 3 biological replicates. Significance was determined by one-way ANOVA followed by Dunnett’s post-hoc test. Panel d was reproduced from https://alphafold.ebi.ac.uk under a CC-BY 4.0 license. |
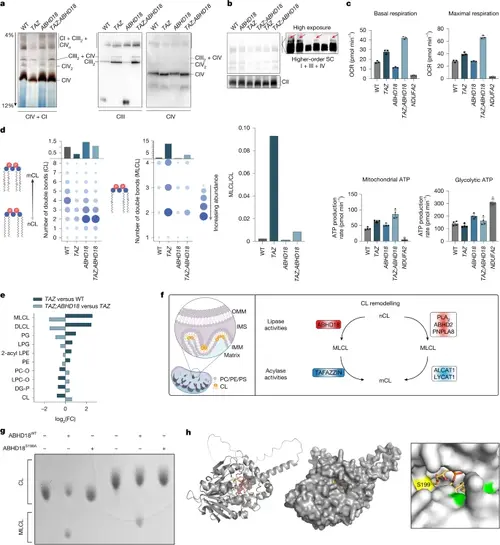
ABHD18 regulates MRC assembly and generates MLCL from nCL. a, IGA assay (CI + CIV; n = 2 biological replicates) and BN–PAGE immunoblots of isolated mitochondria from the indicated HAP1 cells. Blots were probed for CIII (UQCRC2) and CIV (COX IV + MTCO1; n = 3 biological replicates). b, BN–PAGE of the indicated HAP1 cell lines. Inset: long exposure to visualize higher-order supercomplexes (SC, mtCOX-1). c, Seahorse Cell Mito stress test in HAP1 cell lines. Box plots show respiratory parameters: basal respiration, maximal respiration, mitochondrial ATP generation and glycolytic ATP generation. Data are presented as mean ± s.d. of n = 4 technical replicates. d, Effect of TAZ-KO, ABHD18-KO and TAZ;ABHD18 double-KO on CL and MLCL abundance and composition determined by lipidomic profiling. Dot plots show CL (left) and MLCL (middle) abundance in WT and mutant HAP1 cells. The y axes show the aggregate abundance of all species with the same number of double bonds, regardless of carbon chain length, with summary bar plots shown above. Right, bar plot of MLCL/CL ratios across HAP1 cell lines e, Cellular phospholipid composition determined by lipidomics in TAZ-KO and TAZ;ABHD18 double-KO clones. The bar plot shows changes in abundance across lipid classes in TAZ-KO versus HAP1 WT and TAZ;ABHD18 double-KOs versus TAZ-KO cells (n = 3 mutant clones, nWT = 4). Only classes that are deregulated in TAZ-KO cells are shown (Padj < 0.05, determined by one-way ANOVA followed by Tukey’s honest significant difference). f, Schematic illustrating the CL biosynthesis pathway. OMM, outer mitochondrial membrane; IMS, inner mitochondrial space; IMM, inner mitochondrial membrane; PC, phosphatidylcholine; PE, phosphatidylethanolamine; PS, phosphatidylserine. g, Effect of recombinant ABHD18 on purified CL. TLC using purified ABHD18 protein and purified CL(14:1) (lower CL spot) or CL(16:0–18:1) (upper CL spot) shows that ABHD18WT but not ABHD18S199A can produce MLCL from CL. h, In silico molecular docking simulation using the GROMACS package of ABHD18 and a MLCL molecule showing the S199 residue (yellow) and other serine residues (green). Part h was reproduced from https://alphafold.ebi.ac.uk under a CC-BY 4.0 license. |
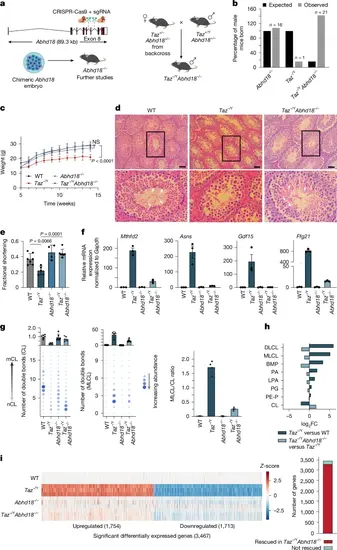
Abhd18 perturbation in Taz−/Y mice rescues BTHS phenotypes. a, Schematic showing the generation of Abhd18−/− and Taz−/Y;Abhd18−/− mice. b, Bar plot depicting the proportions of male mice for the indicated genotypes. The expected Taz−/Y and Abhd18−/− numbers follow the null hypothesis that there is no effect on the number of male mice born; Taz−/Y;Abhd18−/− follows the null hypothesis that there is no rescue of the observed Taz−/Y phenotype. Observed shows the proportion of mice genotyped. c, Body weight of mice more than ten weeks after weaning. Data are mean ± s.d. (WT, n = 8; Taz−/Y, n = 5; Abhd18−/− and Taz−/Y;Abhd18−/−, n = 13 mice). Significance was determined by one-way ANOVA followed by Dunnett’s post-hoc test (Padj = 0 WT versus Taz−/Y at week 14). d, Representative haematoxylin and eosin-stained histological images of mouse testis. White arrowheads show the nuclei of mature sperm in the lumen of seminiferous tubules (inset). The bottom row shows rotated zoomed-in images of the areas in the black boxes. Scale bars, 50 μm. e, Bar graph showing fractional shortening quantified by ultrasound analysis of murine hearts. Data are mean ± s.d. (WT, n = 7; Taz−/Y, n = 5; Abhd18−/−, n = 4; Taz−/Y;Abhd18−/−, n = 7). Significance was determined by one-way ANOVA followed by Tukey’s multiple comparisons test. f, RT–qPCR analysis of indicated gene expression levels from murine hearts, normalized to Gapdh. Data are mean ± s.e.m. (n = 3 mice). Significance determined by one-way ANOVA and Tukey’s multiple comparison test. g, Dot plots of lipidomic analyses of CL (left) and MLCL (middle) species abundance in murine hearts, with summary bar plots shown above. Right, bar plot quantifying MLCL/CL ratios (right). Data are means; n = 6 mice per genotype, except Taz−/Y (n = 4). h, Bar plot of lipid abundance changes in Taz−/Y versus WT, and Taz−/Y;Abhd18−/− versus Taz−/Y murine hearts (n as in panel g). i, Bulk RNA-seq analysis of murine hearts (n = 3 mice per genotype). Significant differentially expressed genes in each genotype (FDR < 0.01, |LFC | > 0.58) are shown, z-normalized to WT samples (left). Right, bar plot showing the number of Taz-KO genes rescued in Taz−/Y;Abhd18−/− mouse heart (right). |
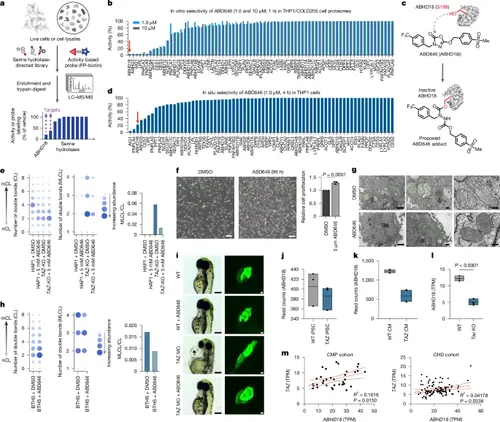
ABD646 phenocopies ABHD18 loss. a, Mass spectrometry-coupled activity-based protein profiling (MS–ABPP) workflow used to identify putative ABHD18 inhibitors. b, In vitro MS–ABPP profile of ABD646 using FP–biotin in a 1:1 mixture of THP1 and COLO205 cell lysates. c, Structure of ABD646 and proposed mechanism of ABHD18 inhibition (ABHD18i) through carbamylation of Ser199. d, In situ MS–ABPP profile of ABD646 using FP–biotin in THP1 cells validating ABHD18 target engagement. e, Lipidomics results for CL (left) and MLCL (middle) species, as well as the MLCL/CL ratio (right), for HAP1 parental and TAZ-KO cells with or without ABD646 for 5 days. f, Images of fibroblasts from patients with BTHS treated with or without ABD646 for 96 h (left) and the corresponding quantification of cell numbers (right). Data are mean ± s.d. (n = 3 biological repeats). Significance was determined by one-way ANOVA followed by Dunnett’s post-hoc test. Scale bars, 200 μm. g, TEM images of fibroblasts from patients with BTHS treated with vehicle or 5 μM ABD646 for 5 days. Mitochondria are coloured green. Scale bars, 1 μm (left) and 200 nm (middle and right). h, Lipidomics results for CL (left) and MLCL (middle) species, as well as the MLCL/CL ratio (right), for fibroblasts from patients with BTHS treated with vehicle or 5 μM ABD646 for 5 days. i, Cardiac phenotypes in Taz-deficient zebrafish treated for 3 days after fertilization with 1 μM ABD646. Bright-field (left; scale bar, 200 μm) and fluorescence images of GFP-labelled hearts (right; scale bar, 50 μm); n = 3 biological repeats. j–l, ABHD18 gene expression in WT or TAZ iPSC cell lines (j; n = 3 cell lines), WT and TAZ-mutant differentiated cardiomyocytes (CM) (k; n = 2 cell lines) and WT and Taz−/Y mice hearts (l; n = 3 mice). Data are median transcripts per million (TPM) ± interquartile range. Significance was determined by one-way ANOVA and Dunnett’s post-hoc test. m, TAZ and ABHD18 gene expression correlation across cardiac patient cohorts: CMP (cardiomyopathy) and CHD (tetralogy of fallout, ventricular septal defects) and healthy heart (pink, control left ventricular; blue, control right ventricular myocardial samples). Data are median TPM ± IQR. PHENOTYPE:
|