
Fig. 1
- ID
- ZDB-FIG-251007-24
- Publication
- Masud et al., 2025 - Genetic suppression features ABHD18 as a Barth syndrome therapeutic target
- Other Figures
- All Figure Page
- Back to All Figure Page
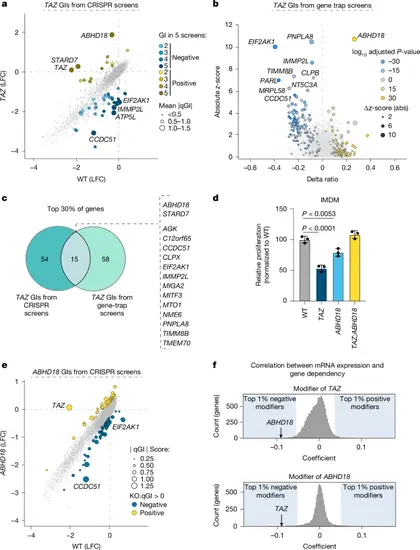
Genetic screens identify ABHD18 as a suppressor of TAZ-mutant fitness defects. a, Scatterplot depicting the genetic effects resulting from pooled CRISPR screens in HAP1 wild-type (WT, n = 39) and TAZ-KO (n = 5, clones 1 and 2) cells plotted as log2-transformed fold change (LFC) values and scaled by quantitative GI (qGI) score. Significant GIs are labelled (mean |qGI | > 0.5, false discovery rate (FDR) < 0.1 n = 5 screens). The node size corresponds to the mean absolute qGI score. b, Scatterplot of viability data from gene-trap mutagenesis screens consisting of two TAZ-KO maps (n = 2) compared with WT controls (n = 4). The Δ(ratioTAZ − ratioWT) is the differential ratio between TAZ-KO and WT cells. The z-score represents the standardized effect size of the TAZ-KO screens compared with a reference of 39 public maps. Significance was determined by Fisher’s exact test (TAZ-KO versus WT; Padj < 0.05) and a binomial test (adjusted P (Padj) < 0.05; TAZ-KO sense versus antisense). The top significant hits are shown. c, Venn diagram showing the overlap of TAZ genetic modifiers (positive and negative) between orthogonal screening methods. The top 30% of genes from each screen were included, ranked by combined qGI and FDR (CRISPR screens) and z-score (gene-trap screens). e, Scatterplot of ABHD18 negative and positive GIs from HAP1 WT (n = 39) and ABHD18-KO (n = 1) pooled CRISPR screens, depicted as in a. d, Bar plot of relative cell proliferation measurements in HAP1 WT, TAZ-KO, ABHD18-KO and TAZ;ABHD18 double-KO cells. Data are presented as mean ± s.d.; n = 3 biological replicates, each performed in technical triplicate with significance (WT versus TAZ, Padj = 0; WT versus ABHD18-KO, Padj = 0.0053) determined by one-way analysis of variance (ANOVA) followed by Dunnett’s post-hoc test. f, Distribution of TAZ (top) and ABHD18 (bottom) genetic modifier likelihood coefficients determined from DepMap data. The top 1% of putative modifiers are shaded. ABHD18 (top) and TAZ (bottom) are indicated. |