
Fig. 5
- ID
- ZDB-IMAGE-251007-23
- Publication
- Masud et al., 2025 - Genetic suppression features ABHD18 as a Barth syndrome therapeutic target
- All Figures
- Figures for Masud et al., 2025
|
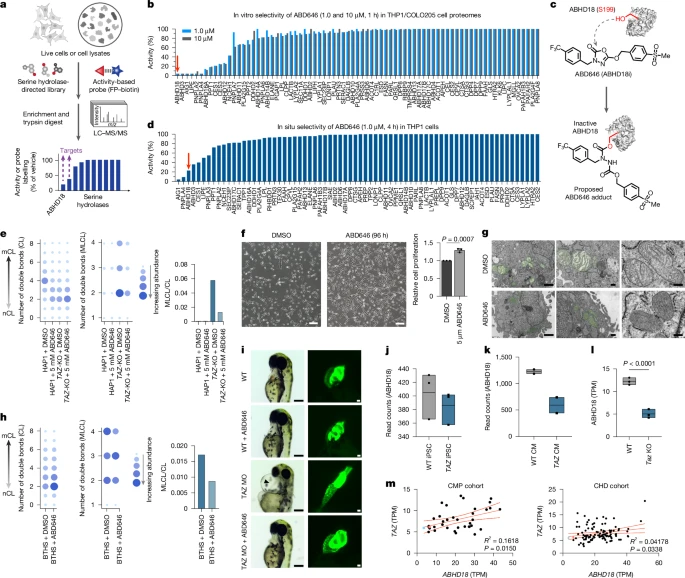
Fig. 5 ABD646 phenocopies ABHD18 loss. a, Mass spectrometry-coupled activity-based protein profiling (MS–ABPP) workflow used to identify putative ABHD18 inhibitors. b, In vitro MS–ABPP profile of ABD646 using FP–biotin in a 1:1 mixture of THP1 and COLO205 cell lysates. c, Structure of ABD646 and proposed mechanism of ABHD18 inhibition (ABHD18i) through carbamylation of Ser199. d, In situ MS–ABPP profile of ABD646 using FP–biotin in THP1 cells validating ABHD18 target engagement. e, Lipidomics results for CL (left) and MLCL (middle) species, as well as the MLCL/CL ratio (right), for HAP1 parental and TAZ-KO cells with or without ABD646 for 5 days. f, Images of fibroblasts from patients with BTHS treated with or without ABD646 for 96 h (left) and the corresponding quantification of cell numbers (right). Data are mean ± s.d. (n = 3 biological repeats). Significance was determined by one-way ANOVA followed by Dunnett’s post-hoc test. Scale bars, 200 μm. g, TEM images of fibroblasts from patients with BTHS treated with vehicle or 5 μM ABD646 for 5 days. Mitochondria are coloured green. Scale bars, 1 μm (left) and 200 nm (middle and right). h, Lipidomics results for CL (left) and MLCL (middle) species, as well as the MLCL/CL ratio (right), for fibroblasts from patients with BTHS treated with vehicle or 5 μM ABD646 for 5 days. i, Cardiac phenotypes in Taz-deficient zebrafish treated for 3 days after fertilization with 1 μM ABD646. Bright-field (left; scale bar, 200 μm) and fluorescence images of GFP-labelled hearts (right; scale bar, 50 μm); n = 3 biological repeats. j–l, ABHD18 gene expression in WT or TAZ iPSC cell lines (j; n = 3 cell lines), WT and TAZ-mutant differentiated cardiomyocytes (CM) (k; n = 2 cell lines) and WT and Taz−/Y mice hearts (l; n = 3 mice). Data are median transcripts per million (TPM) ± interquartile range. Significance was determined by one-way ANOVA and Dunnett’s post-hoc test. m, TAZ and ABHD18 gene expression correlation across cardiac patient cohorts: CMP (cardiomyopathy) and CHD (tetralogy of fallout, ventricular septal defects) and healthy heart (pink, control left ventricular; blue, control right ventricular myocardial samples). Data are median TPM ± IQR.