
Fig. 2
- ID
- ZDB-FIG-251007-25
- Publication
- Masud et al., 2025 - Genetic suppression features ABHD18 as a Barth syndrome therapeutic target
- Other Figures
- All Figure Page
- Back to All Figure Page
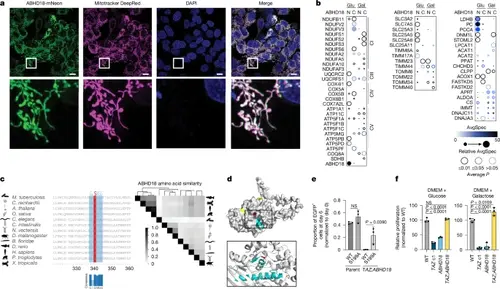
ABHD18 is a putative mitochondrial serine hydrolase. a, Live-cell fluorescence microscopy of HAP1 cells expressing mNeon-tagged ABHD18 (n = 1). Top, mitochondria are stained with Mitotracker DeepRed (purple) and nuclei with DAPI (blue). Bottom, expanded views of the areas in the white square. Scale bars, 10 μm. b, Dot plots of miniTurbo-tagged (at the amino or carboxy terminus) ABHD18 grown in either glucose or galactose and assessed by BioID (n = 3 biological replicates). AvgSpec, average spectral count. c, Sequence alignment of ABHD18 orthologues from Mycobacterium tuberculosis, Chlamydomonas reinhardtii, Arabidopsis thaliana, Oryza sativa, Caenorhabditis elegans, Ciona intestinalis, Nematostella vectensis, Drosophila melanogaster, Branchiostoma floridae, Danio rerio, Homo sapiens, Pan troglodytes and Xenopus tropicalis (left). The canonical serine hydrolase motif is highlighted in blue, with the conserved serine residue in red. The heatmap shows amino acid sequence similarity between ABHD18 orthologues determined by Clustal Omega (right). Similarity profiles were hierarchically clustered. d, Predicted Alphafold structure of ABHD18 with a putative catalytic site containing a serine residue (red). Exon 8 sequences are highlighted in cyan and the N and C termini are yellow. e, Competitive growth assay of HAP1 cell lines expressing ABHD18(WT)–eGFP or catalytic dead ABHD18(S199A)–eGFP. The indicated lines were co-cultured with HAP1 WT–Cherry and quantified by flow cytometry over 6 days. Bar plots show the eGFP+ proportion normalized to day 0. Data are presented as mean ± s.d. of n = 3 biological replicates, with significance determined by one-way ANOVA followed by Tukey’s multiple-comparisons test. f, Proliferation assay comparing single TAZ-KO (Padj = 0), ABHD18-KO (Padj = 0) and double-mutant TAZ;ABHD18 double-KO (Padj = 0.0109) in GAL effects in glucose-supplemented (left) or galactose-supplemented (right) DMEM, normalized to the WT. Data are presented as mean ± s.d., n = 3 biological replicates. Significance was determined by one-way ANOVA followed by Dunnett’s post-hoc test. Panel d was reproduced from https://alphafold.ebi.ac.uk under a CC-BY 4.0 license. |